


Update: Labor Market Recovery Stalls as COVID-19 Cases Surge
Research and insights from Alexander W. Bartik, Marianne Bertrand, Feng Lin, Jesse Rothstein, and Matt Unrath.
Update: Labor Market Recovery Stalls as COVID-19 Cases Surge
As COVID-19 cases decline, vaccination rates rise, and pandemic-related restrictions are relaxed, the American labor market is recovering from the large job losses that occurred in March and April 2020. There has been particular interest in how employment is recovering in retail, hospitality, and food services—the sectors that experienced the largest declines in employment at the start of the pandemic.
We’re working with Homebase data to better understand how workers and firms in these sectors have been responding to the reopening of the economy. Homebase provides timecard, scheduling, and other workforce management services to small and medium-sized businesses, many in the food services and retail sectors. As part of these services, Homebase provides a hiring tool to their client firms that allows them to post job openings on all the main hiring websites and aggregate applications received across these hiring websites.
These hiring tool data allow us to measure at high-frequency how job posts and applications are evolving at small and medium-sized businesses providing in-person services (see our previous post and paper documenting the characteristics of Homebase clients in general for more information). These businesses are heavily concentrated in sectors like food and drink and retail that have been most impacted by the COVID-19 crisis. Their jobs typically require in-person work, potentially raising concerns about virus exposure risks; offer relatively modest wages, with average offered hourly wages around $12-15; and require little in the way of formal training or credentials.
Below, we present some preliminary analyses of how job postings, applications, and posted wages have been evolving at Homebase client firms from January 2019 to May 2021. For this analysis, we include all job posts made through the Homebase hiring product, and tabulate all applications made through that tool within seven days of the posting. We believe this will be useful for those seeking to understand the evolving tightness of the labor market, potential difficulties that employers may be having in attracting workers, and how wages may evolve in the most seriously impacted sectors of the economy. We plan on updating these results from June 2021 through the fall of 2021.
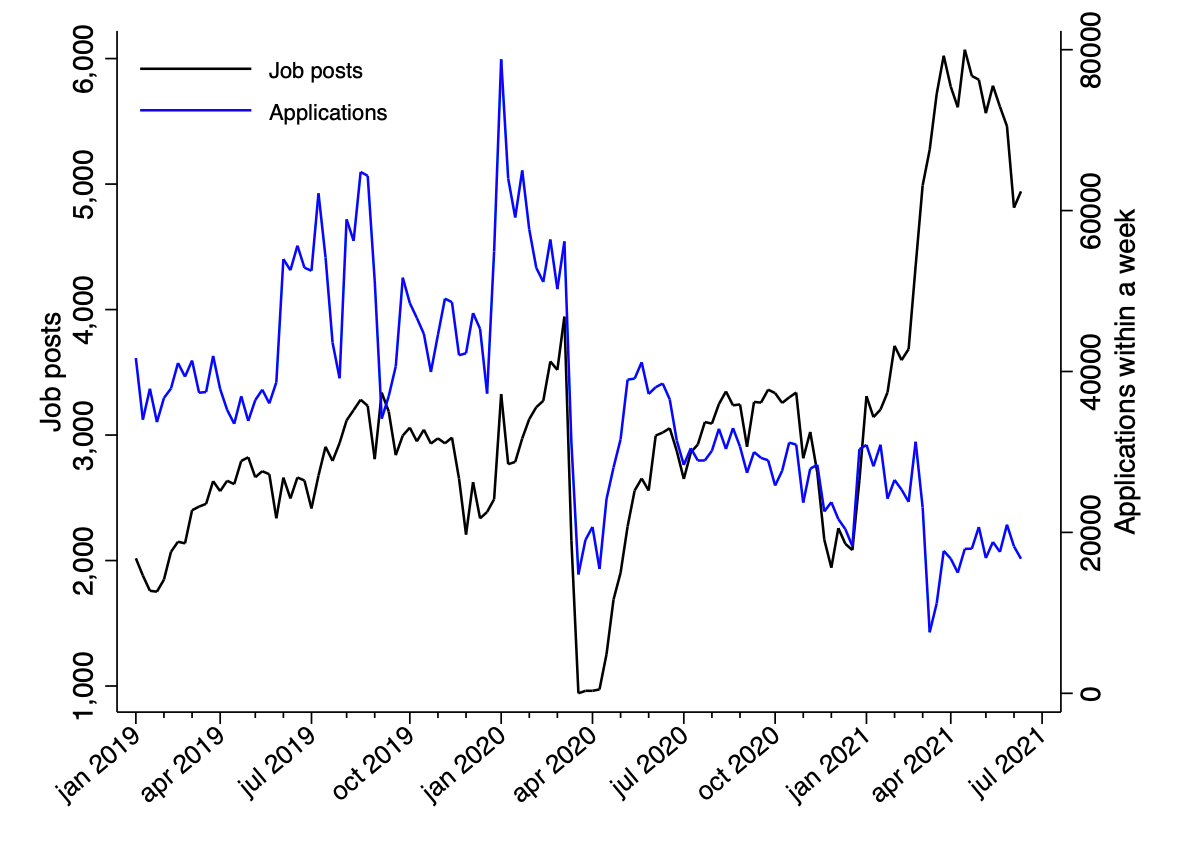
Figure 1 shows that new job postings sharply declined in April 2020 but rebounded quickly to pre-pandemic levels by early summer 2020. After another smaller drop in the fall of 2020, the number of new job postings increased dramatically, to about twice the pre-pandemic level, beginning in late 2020. In contrast, the number of job applications, while it partly recovered from a sharp drop in April 2020, has been trending down since then, and fell off notably further in early March 2021.
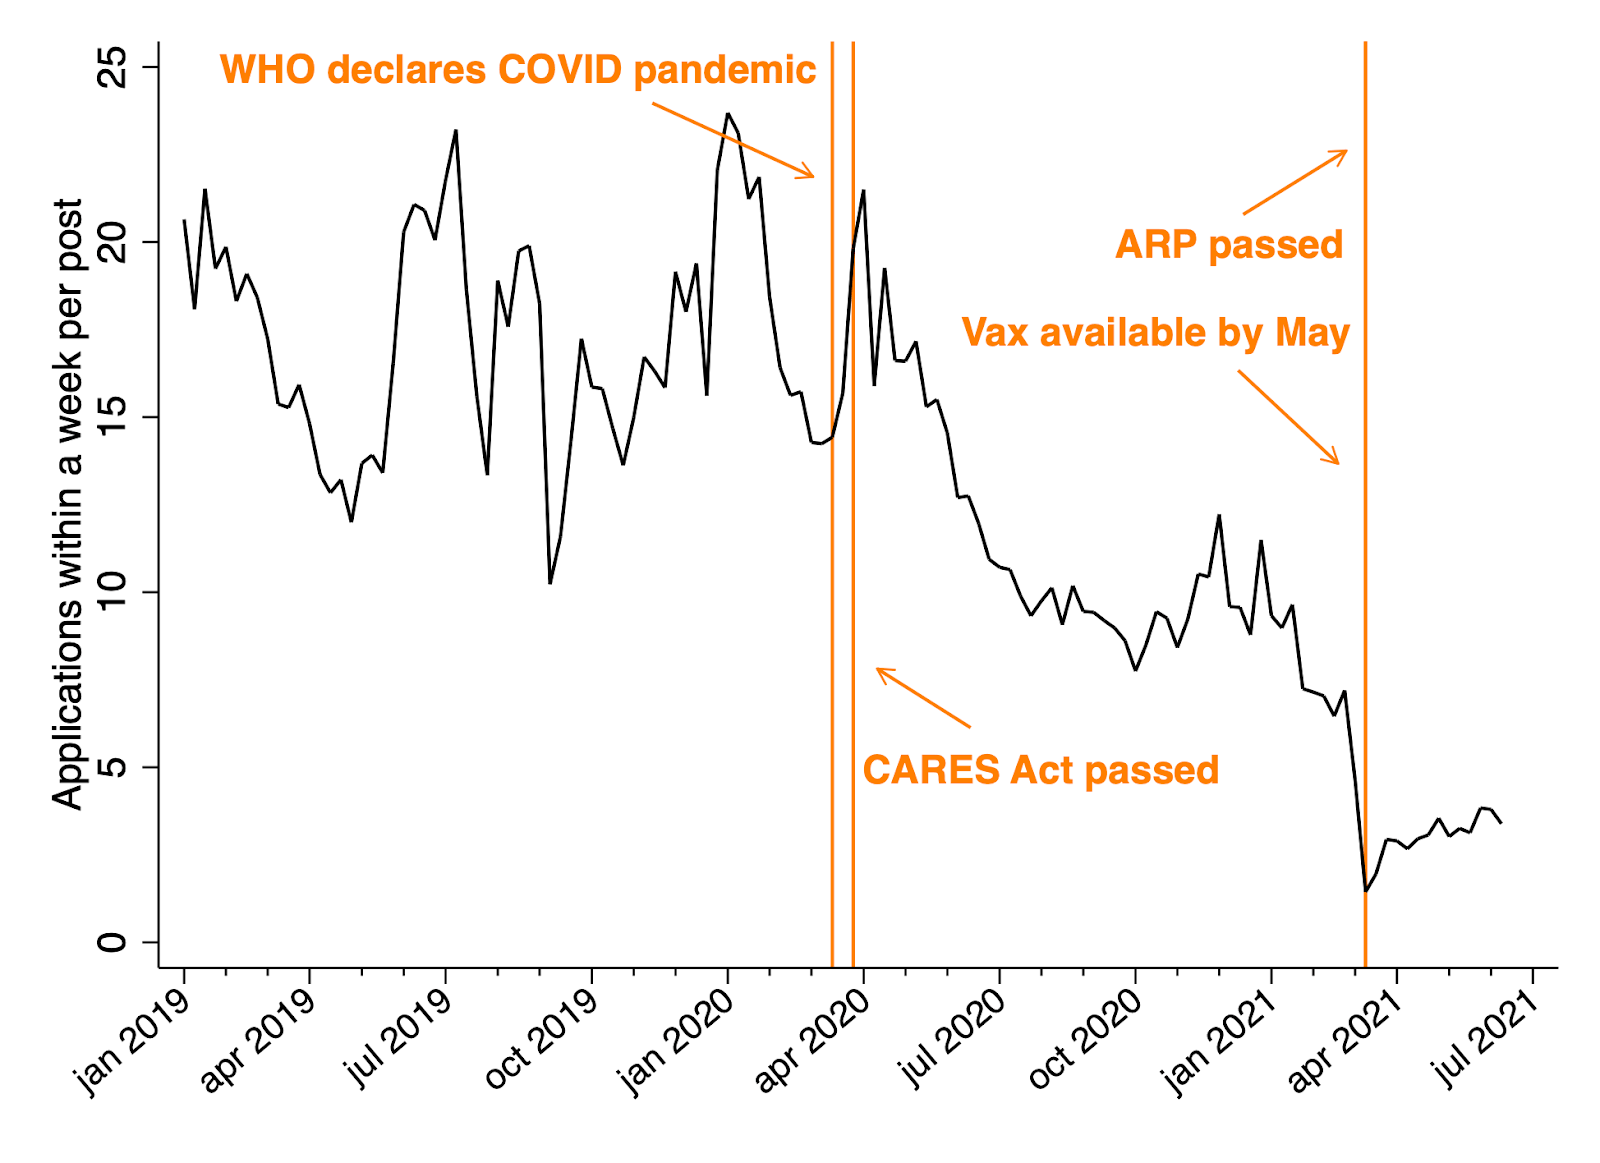
The average number of applications per job posting has been declining since the spring of 2020 (Figure 2a). For reference, we also include vertical lines marking significant COVID-19 virus or policy-related news during this time period, including the start of the pandemic, passage of the CARES act, growth in vaccine availability and passage of the American Recovery Plan (ARP). Before the pandemic, Homebase clients received on average 15 to 20 applications within a week of new job postings. However, that number was down to less than 10 by the summer of 2020. It stabilized around that level until the end of 2020 but then declined to about two applications per posting by the end of March 2021 and has remained at about that level since. This pattern is robust to discounting postings that receive large numbers of applications; when we count only up to 10 applications per posting, the average number of applications per post has fallen by 53 percent since before the pandemic. The pattern is also similar if we focus on jobs that receive more than 10 applications, which falls by 45 percent since before the pandemic.
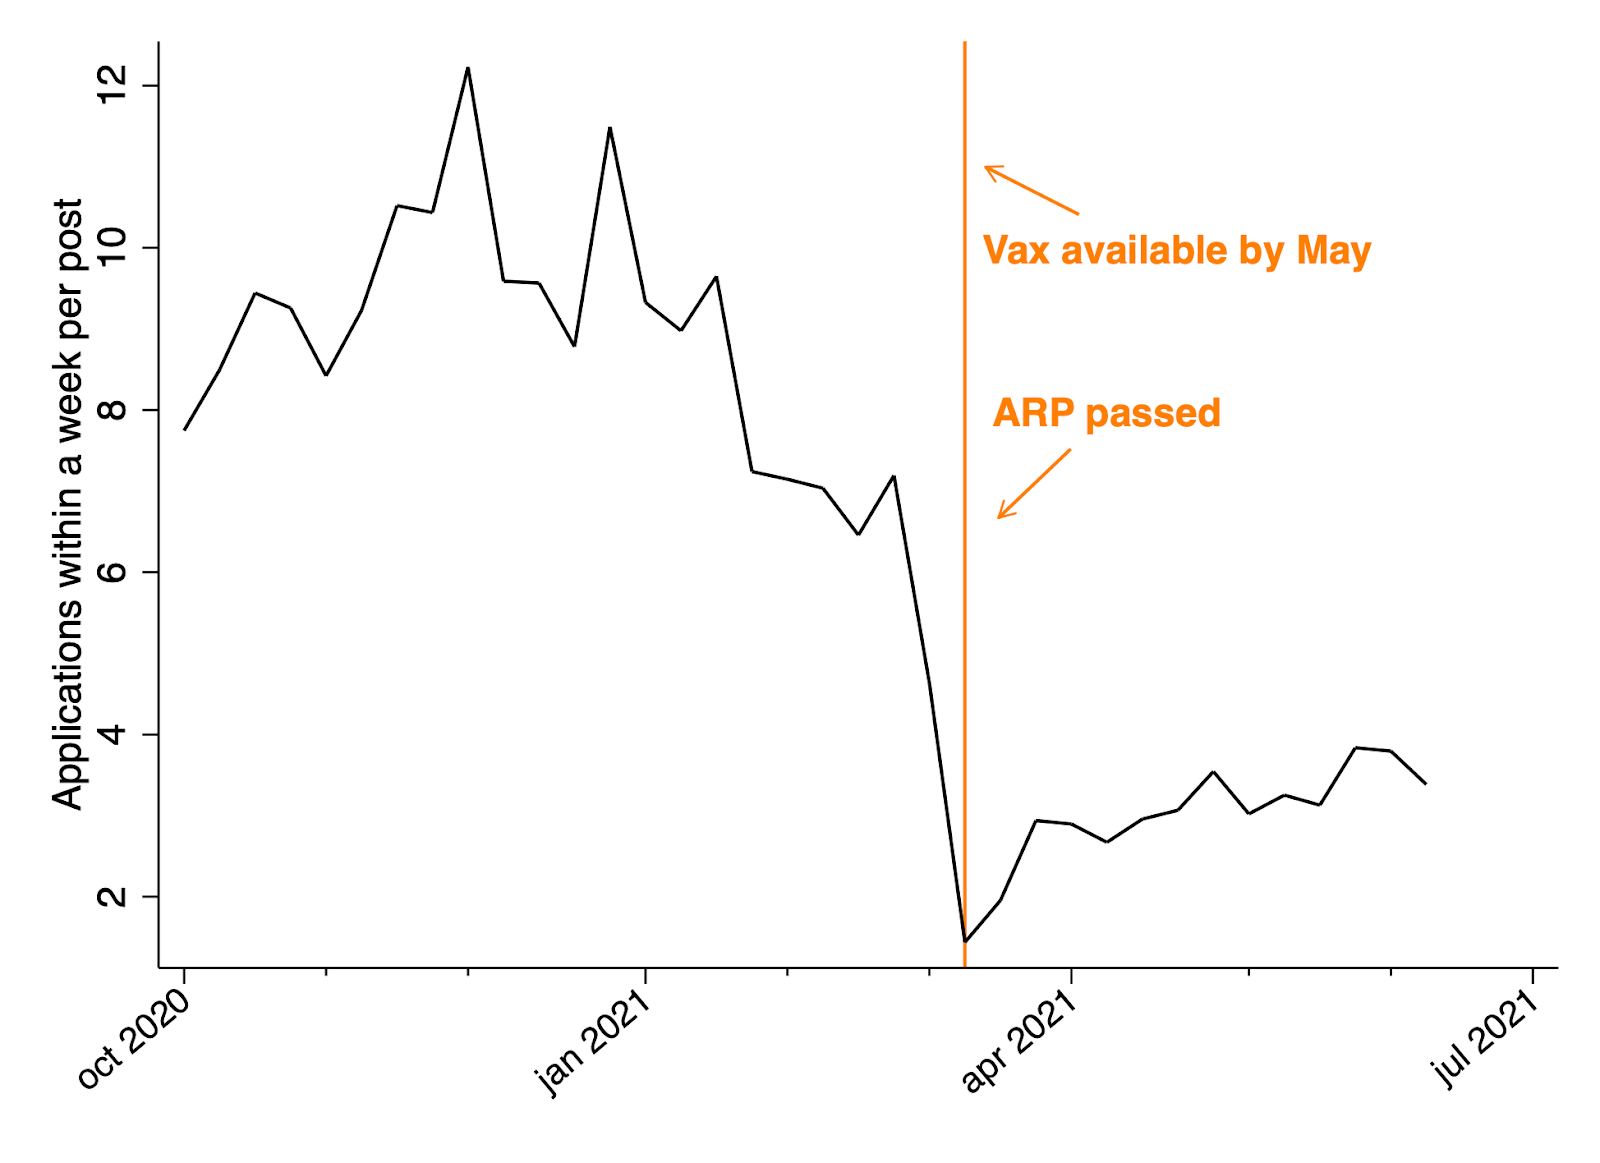
As can be seen in Figure 2b, where we zoom in on November 2020 through May 2021, the sharp drop in the average number of applications per job posting happened between the 9th and 10th week of 2021. This was due to the combined sharp increase in the total number of new job postings starting that week and the less sharp but still visible (Figure 1) decrease in the total number of job applications in that same week. This roughly coincides with the date when vaccines became available to all adults (May 1) and with the passage of the American Rescue Plan (March 1) and FFRCA (March 10). Applications per post then rise from mid-March through mid-June, but not nearly enough to offset the large decline from November 2020 through March 2021.
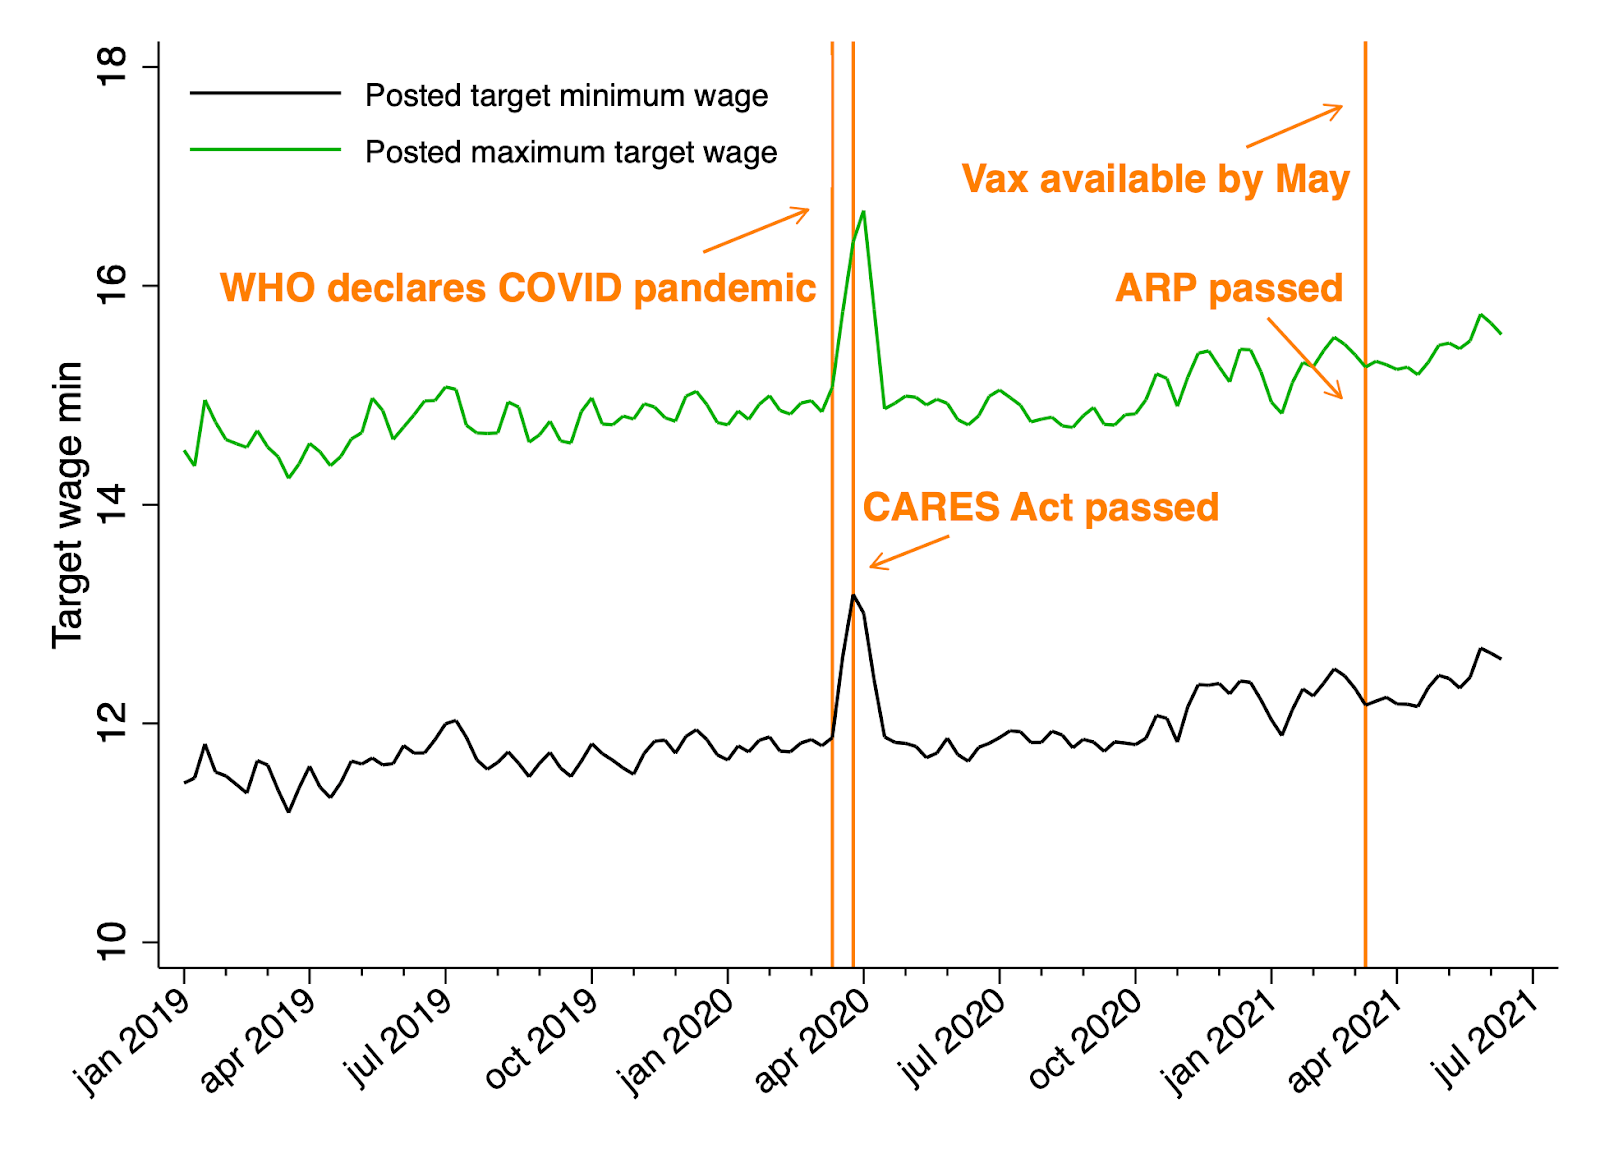
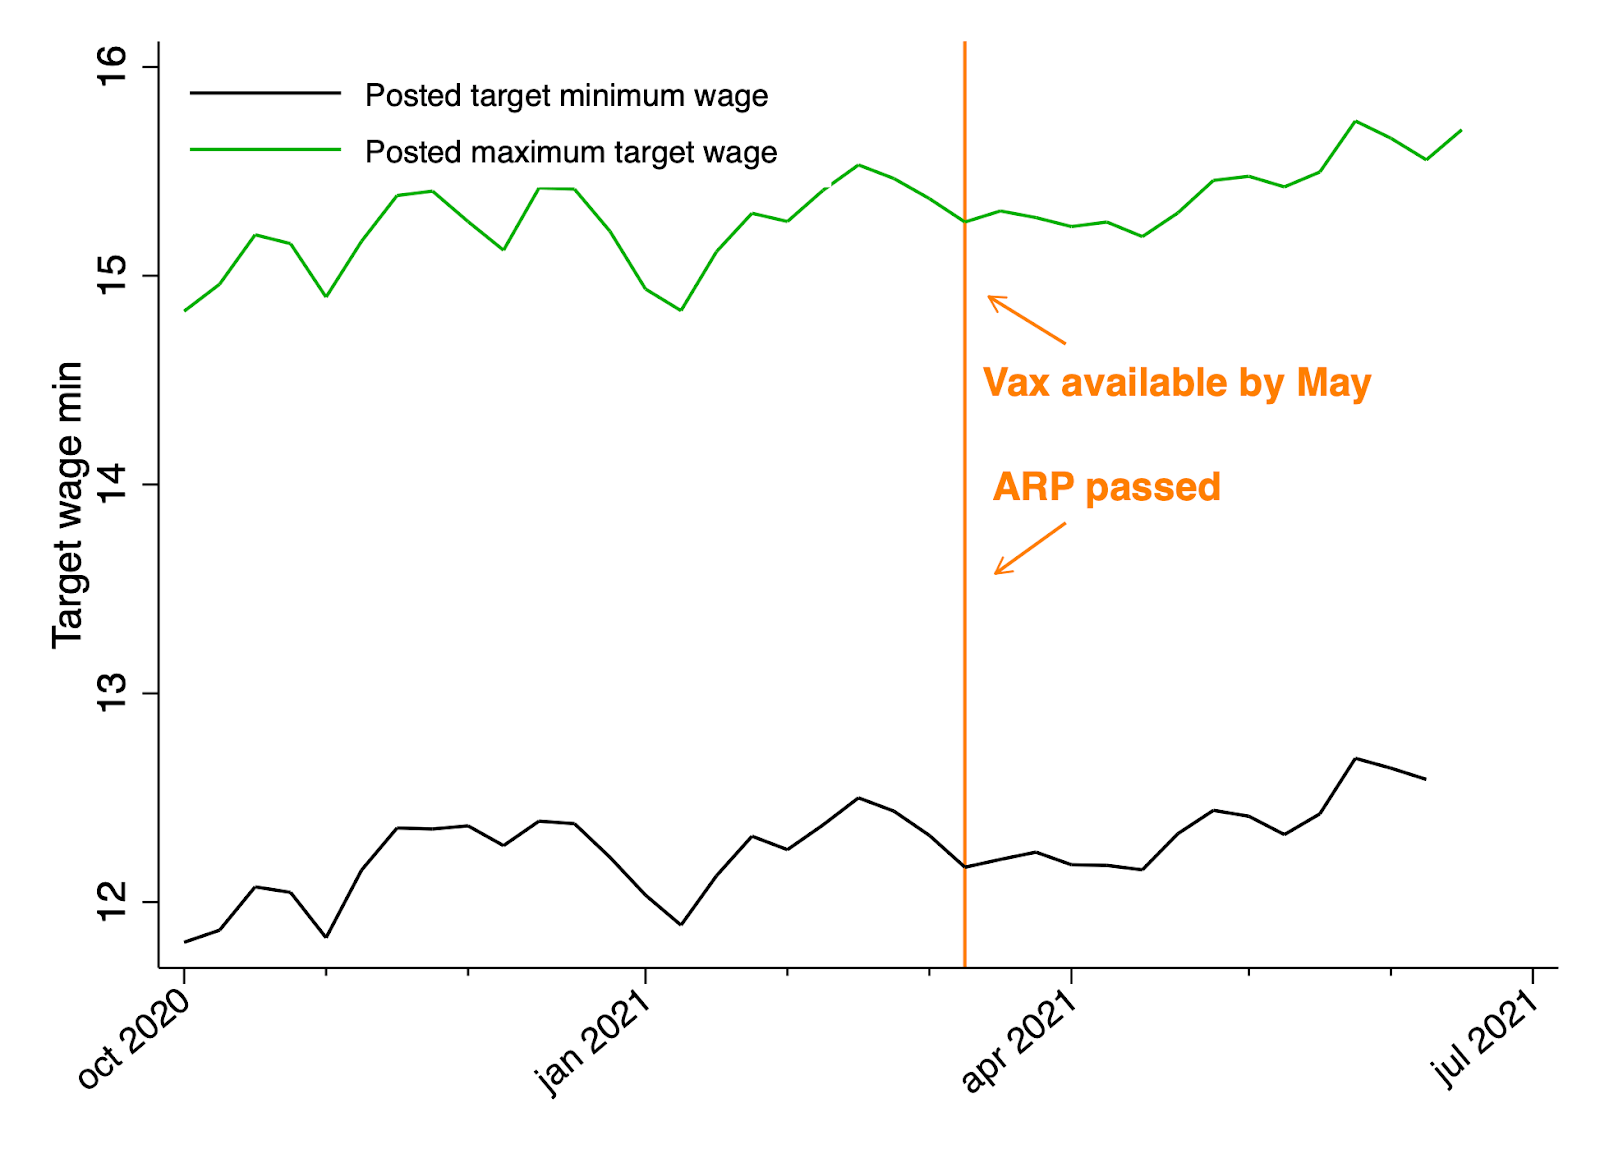
A natural question in light of the patterns above is whether employers have responded to the reduced number of job applications they received by posting higher wages for the job openings. Most Homebase job-postings include information on offered wages, typically expressed as a target wage range. Figures 3a and 3b report the time series of average target wage minimum and average target wage maximum (winsorized at $25/hour) over the period January 2019-May 2021 and November 2020-May 2021, respectively.
Despite the sharp decrease in the number of applications per posting observed in Figures 2a and 2b, average posted wages (whether minimum or maximum) have not changed much. In particular, there is little sign that employers have responded to the increasing apparent tightness of the labor market by substantially increasing posted wages on the Homebase hiring platform (though offered or negotiated wages, or signing-bonuses and other fixed payments, may exhibit a different temporal pattern).
Check back to Rustandy's Coronavirus Social Impact Research page for the latest results. Read the press announcement.
Alexander W. Bartik, Assistant Professor Economics, University of Illinois at Urbana-Champaign, and Research Affiliate, UChicago’s Inclusive Economy Lab; Marianne Bertrand, Chris P. Dialynas Distinguished Service Professor of Economics, University of Chicago Booth School of Business, and Faculty Director, Chicago Booth's Rustandy Center for Social Sector Innovation and UChicago’s Inclusive Economy Lab; Fern Ramoutar, PhD Candidate, Chicago Booth; Jesse Rothstein, Professor of Public Policy and Economics, University of California, Berkeley, and Faculty Director, California Policy Lab, and Daniela Santos-Cardenas, PhD Student, University of Zurich, Department of Economics
Research and insights from Alexander W. Bartik, Marianne Bertrand, Feng Lin, Jesse Rothstein, and Matt Unrath.
Update: Labor Market Recovery Stalls as COVID-19 Cases Surge