


How are Americans Coping with the COVID-19 Crisis? 7 Key Findings from Household Survey
- By
- April 23, 2020
- Rustandy Center for Social Sector Innovation
Related: See the latest data from the U.S. household survey
A team of researchers at the Poverty Lab and the Rustandy Center for Social Sector Innovation at the University of Chicago has been administering a longitudinal survey on a representative sample of the U.S. population. Currently in its third of six waves, the survey aims to collect information about how Americans are reacting to the COVID-19 crisis, how they’re coping with physical distancing measures, and how this unprecedented crisis might be changing their views about the economy, politics, the role of government, and the future of their country.
In partnership with NORC at the University of Chicago, an independent, non-partisan research institution, researchers will regularly release key insights from the survey responses. Below we summarize a limited set of findings from the first wave, which was administered to more than 1,400 Americans using a sample drawn from NORC's probability-based AmeriSpeak Panel, which is designed to be representative of the U.S. population, during the week of April 6-11, 2020.
Finding #1- Lower-income Americans, especially women within this group, were more likely to lose their income in the first month of the crisis
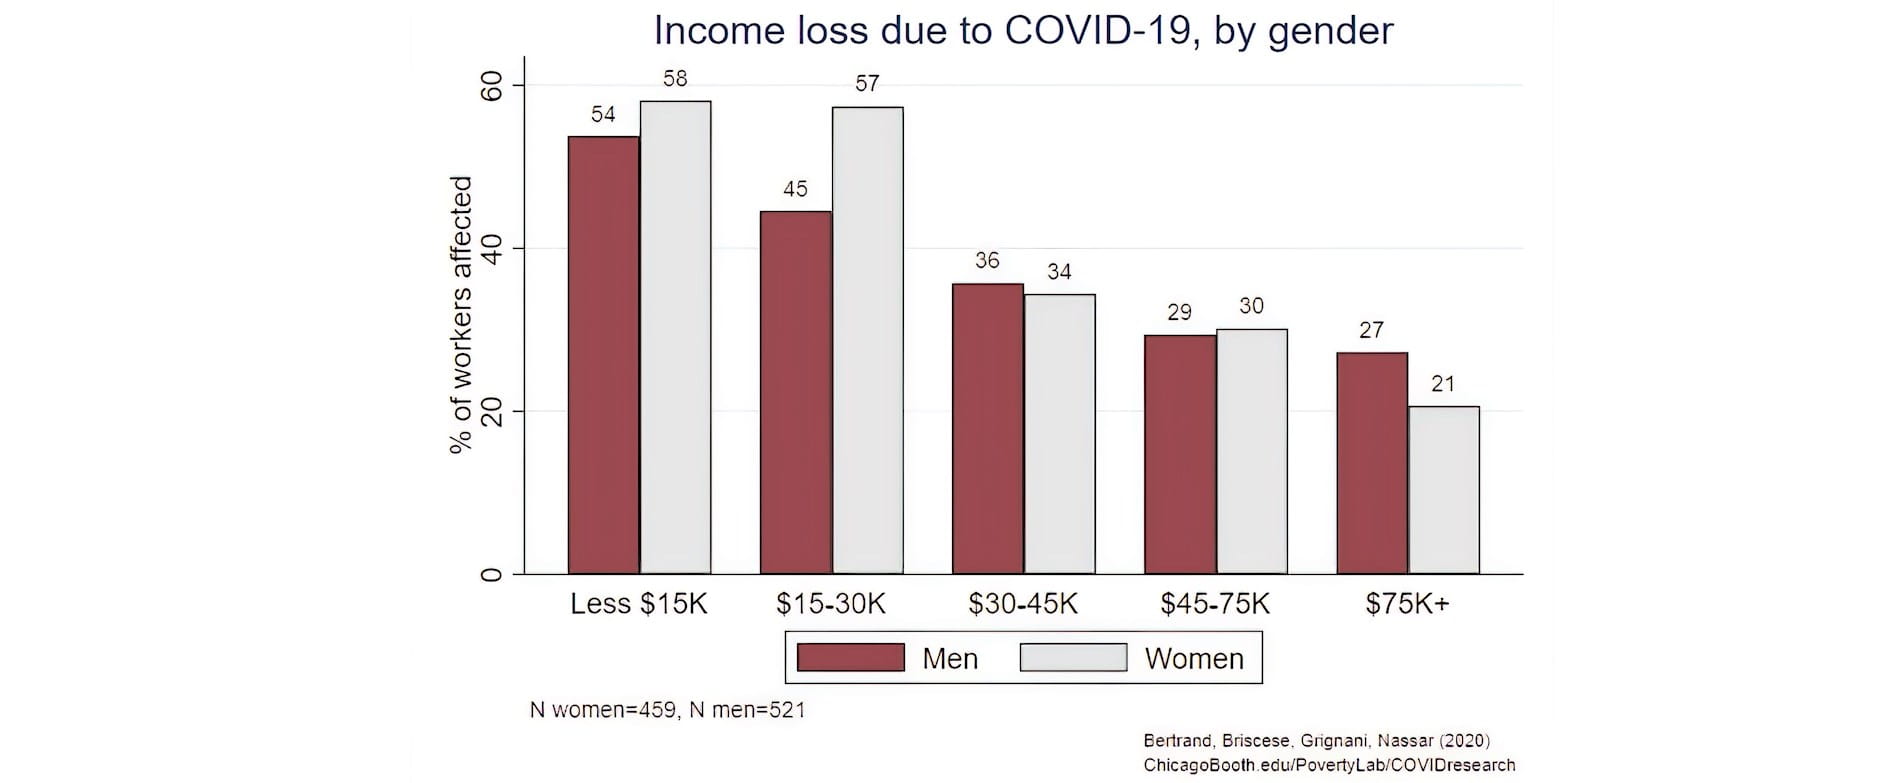
Notes: The graph shows the percentage of workers who reported having suffered an income loss because of a change in their employment status due to COVID-19, split by respondents’ gender. Income groups refer to income per capita 1.
In the survey we asked respondents who were employed as of January 2020 whether their employment status had changed as a result of the COVID-19 crisis, and whether the change resulted in a reduction of employment-generated income. The most striking insight of the bar graph above is that the percentage of affected workers doubles approximately between households living on a $75K+ per-capita income and those on less than $30K annually. Equally remarkable is how the crisis has affected women more than men within the lower income households.
Finding #2- Depending on their race, the crisis is impacting Americans disproportionately
The coronavirus crisis has also impacted Americans unequally depending on their race. The crisis has disproportionately impacted Americans on the two lowest income groups, but non-whites have been affected somewhat more homogenously across most income groups.
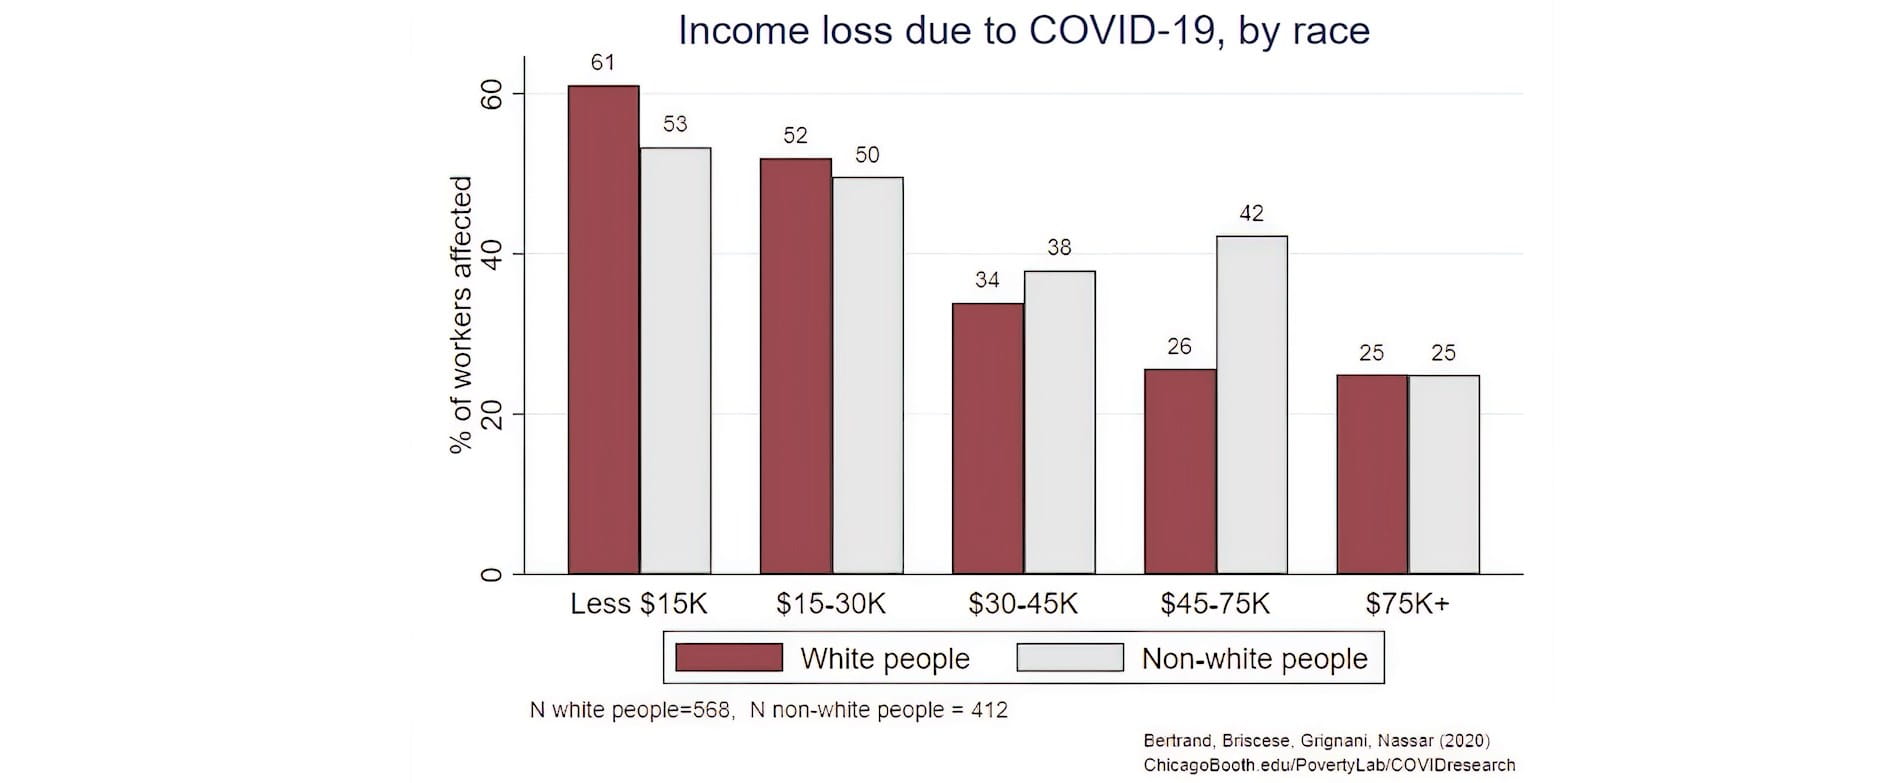
Notes: The graph shows the percentage of workers who reported having suffered an income loss because of a change in their employment status due to COVID-19, split by respondents’ race. Income groups refer to household income, accounting for family size.
Finding #3: Low-income households are also bearing the brunt of worry when it comes to job, income stability, and health-care coverage
The crisis is already having its toll on the mental and emotional wellbeing of many Americans, with low-income households being the most concerned about their job, income stability, and health-care coverage. In a set of questions, respondents were asked to report how worried they were on a scale 1 (not worried at all) to 10 (very worried) about a series of negative consequences due to the coronavirus.
More than half of low-income respondents reported being worried about losing their job, compared to a less than 20 percent of higher income Americans. Similar proportions are visible when people were asked to report on their concerns about their health-care coverage and investments (e.g. retirement and college savings).
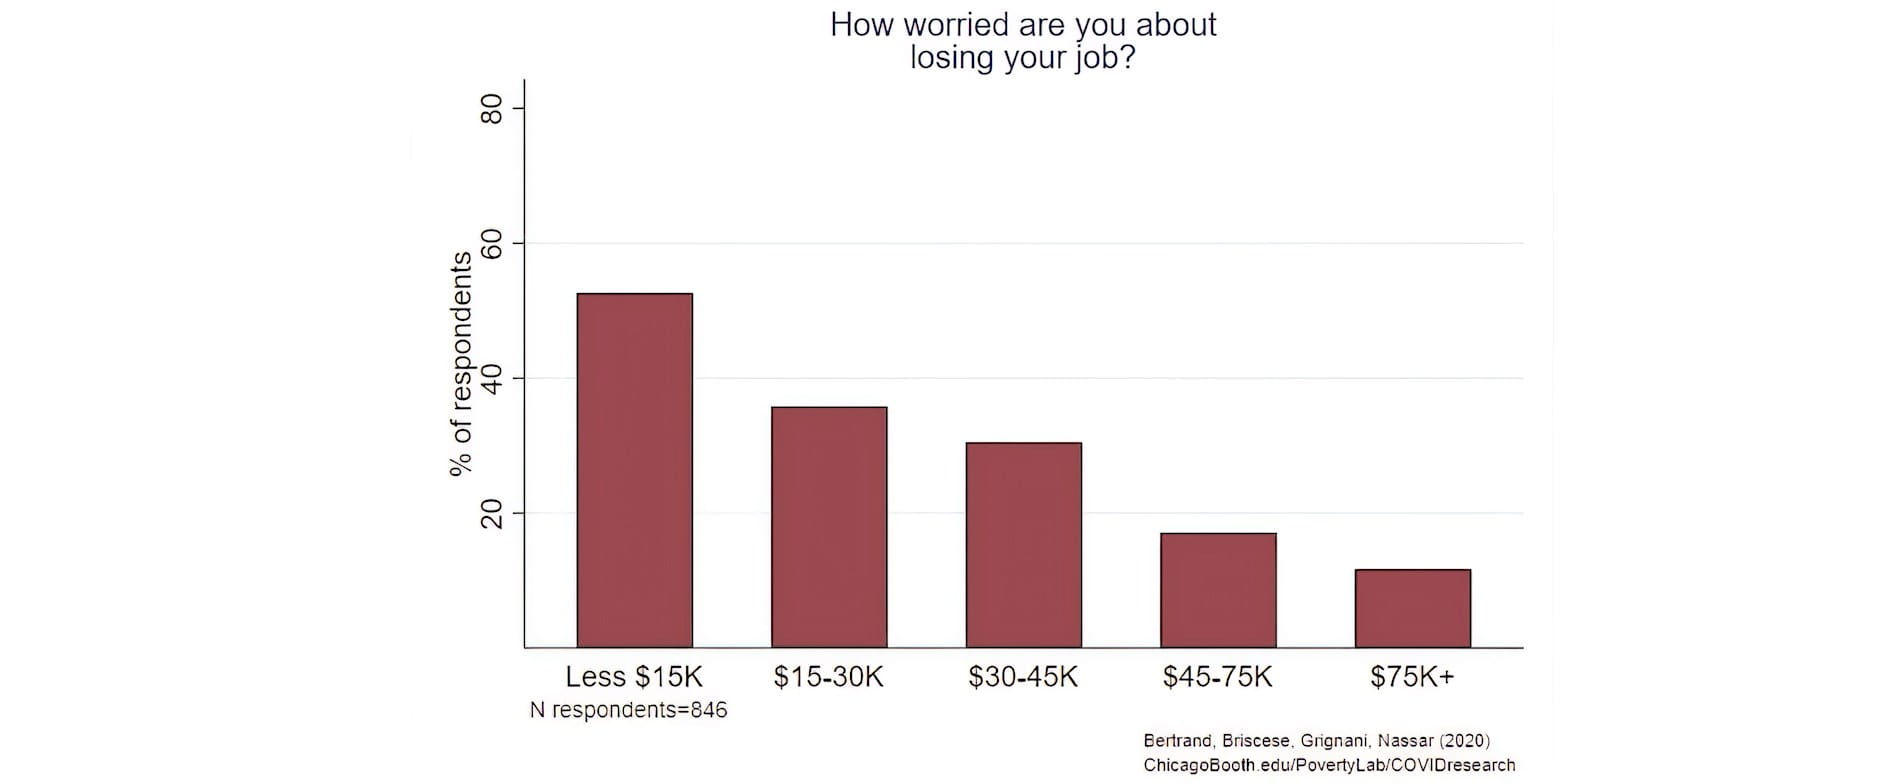
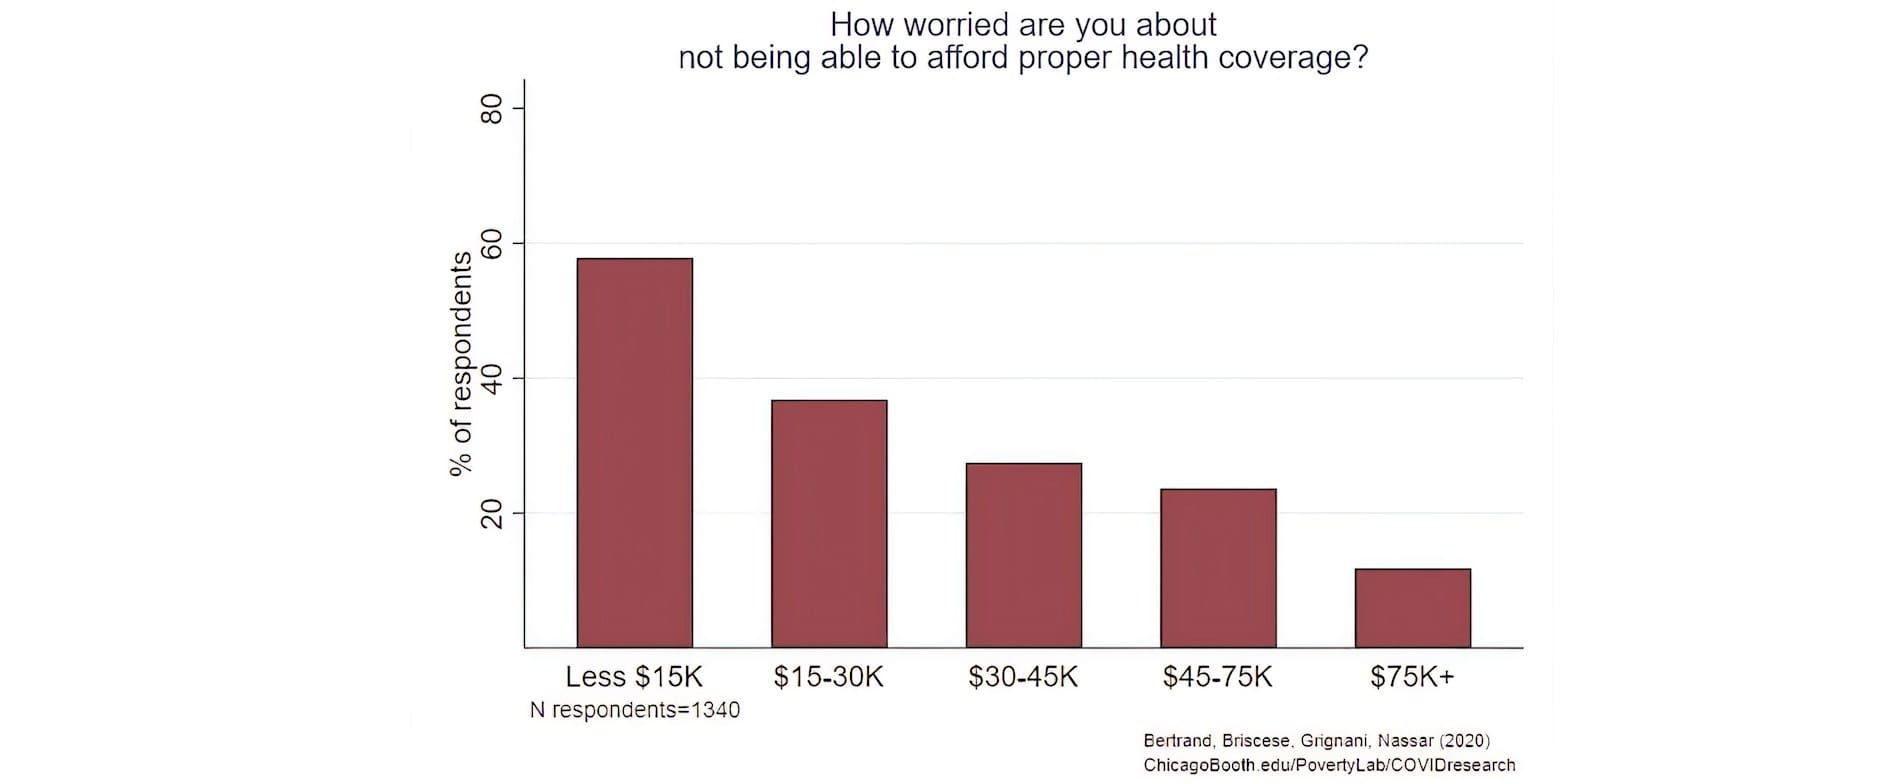
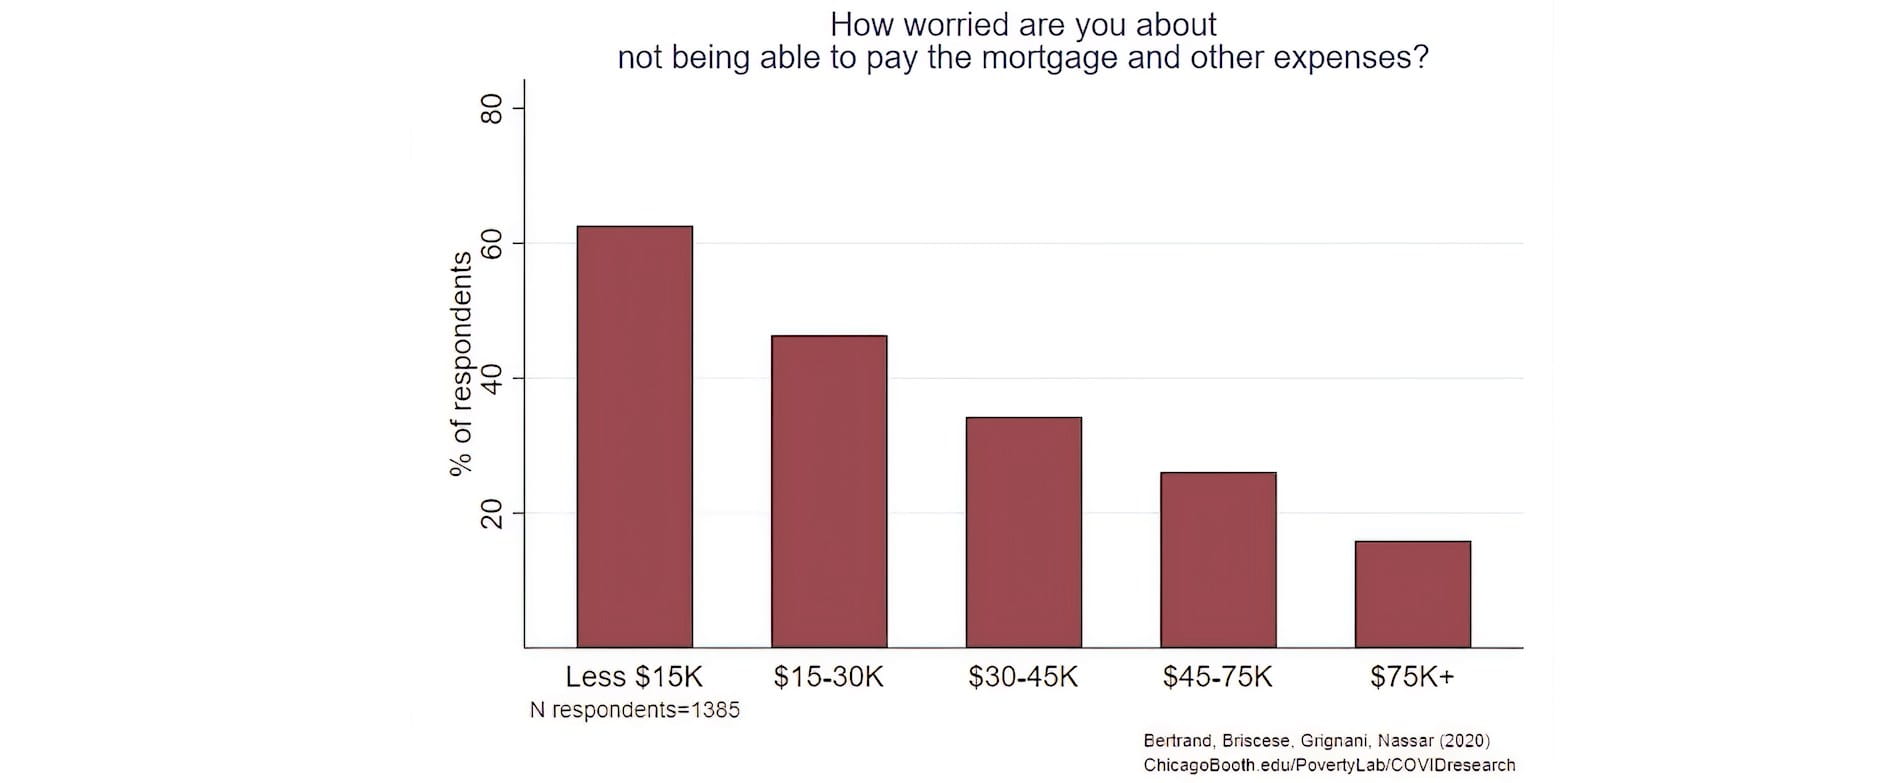
Notes: The graphs show the percentage of respondents who said are worried about losing their job (top), not being able to afford proper health coverage (middle) and not being able to pay mortgage and other expenses (bottom). Percentages refer to respondents who reported being worried at least 5 on a Likert scale 1 to 10.
Americans living in lower income households are substantially more worried about being unemployed, losing their health-care coverage and not being able to afford mortgage and other expenses. These preliminary analyses are showing how the coronavirus is further exaggerating pre-existing inequalities in the U.S., and how quickly (the survey was administered in the first week of April) the crisis has already hit lower-income Americans.
Finding #4: Americans are mostly supportive of stay-at-home Covid-19 measures, but support is influenced by their sources of COVID-19 information
Survey participants were asked whether they thought the media was exaggerating the gravity of the COVID-19 situation, and in an end-of-survey question were also asked to report which sources of news they relied on to get updates about the coronavirus emergency. By cross-checking these two questions, it is possible to see how different sources of information influence the public’s perception about the gravity of the crisis. About 20 percent of Americans believe that the media is exaggerating the gravity of the COVID-19 situation, compared to 51 percent who believe that the media representation is accurate; 21 percent instead believe the media is underreporting the gravity of the situation, and about 8 percent believes it is spreading false information. Respondents who believe the media is exaggerating the gravity of the situation are somewhat more likely to get their COVID-19 news from President Trump and less likely to get their COVID-19 news from statements by government agencies (e.g. local, state, and federal).
Finding #5: Almost 40 percent of Americans do not believe that the COVID-19 outbreak is the most pressing policy priority in the country for the next 12 months
In the survey, respondents were also asked to select, among a set of options, which one was the most pressing priority in the U.S. in the next 12 months. The options included the coronavirus outbreak, climate change, unemployment, the upcoming presidential elections, immigration, income inequality, and access to health care. For almost 40 percent of Americans, the COVID-19 outbreak was not the top priority in the country for the next 12 months. However, respondents across both political parties shared the same top three priorities – namely, COVID-19, unemployment, and the upcoming presidential elections – while they differed on the order of the less important policy priorities.
| DEMOCRATS |
REPUBLICANS |
|---|---|
| Top 3 priorities | |
| COVID-19 | COVID-19 |
| Unemployment | Unemployment |
| Upcoming Presidential elections | Upcoming Presidential elections |
| Bottom 3 priorities | |
| Access to healthcare | Immigration |
| Climate change | Access to healthcare |
| Immigration | Climate change |
Preliminary analysis shows that, after controlling for a person’s political affiliation and education level, those who believed that the media was exaggerating the situation were significantly more likely to report that the coronavirus outbreak was not the most important priority in the U.S. for the next 12 months.
Finding #6: Most Americans report being compliant with the virus containment policies, such as stay-at-home orders, but are optimistic physical distancing measures will be over soon
By March 16 most U.S. states began adopting a series of policies to contain the spread of the virus, such as physical distancing measures. The success of these policies is inevitably dependent on the public’s willingness to comply. People were asked to report which daily behaviors they were adopting to prevent contagion among a set of options: sneeze in elbow; use delivery more often; keep a safe distance from others; try not touching objects when outside; wash hands more thoroughly and frequently; and cover their mouths in public.
Most Americans are adopting more than half of these measures in their daily lives. A higher household income is associated with a higher degree of compliance, but this is particularly true for Democratic voters. In particular, lower income Republican voters appear to be outliers, reporting a substantially lower level of compliance, even compared to other Republican households of slightly higher income levels. The same difference is observable about respondents’ willingness to comply with stay-at-home measures.
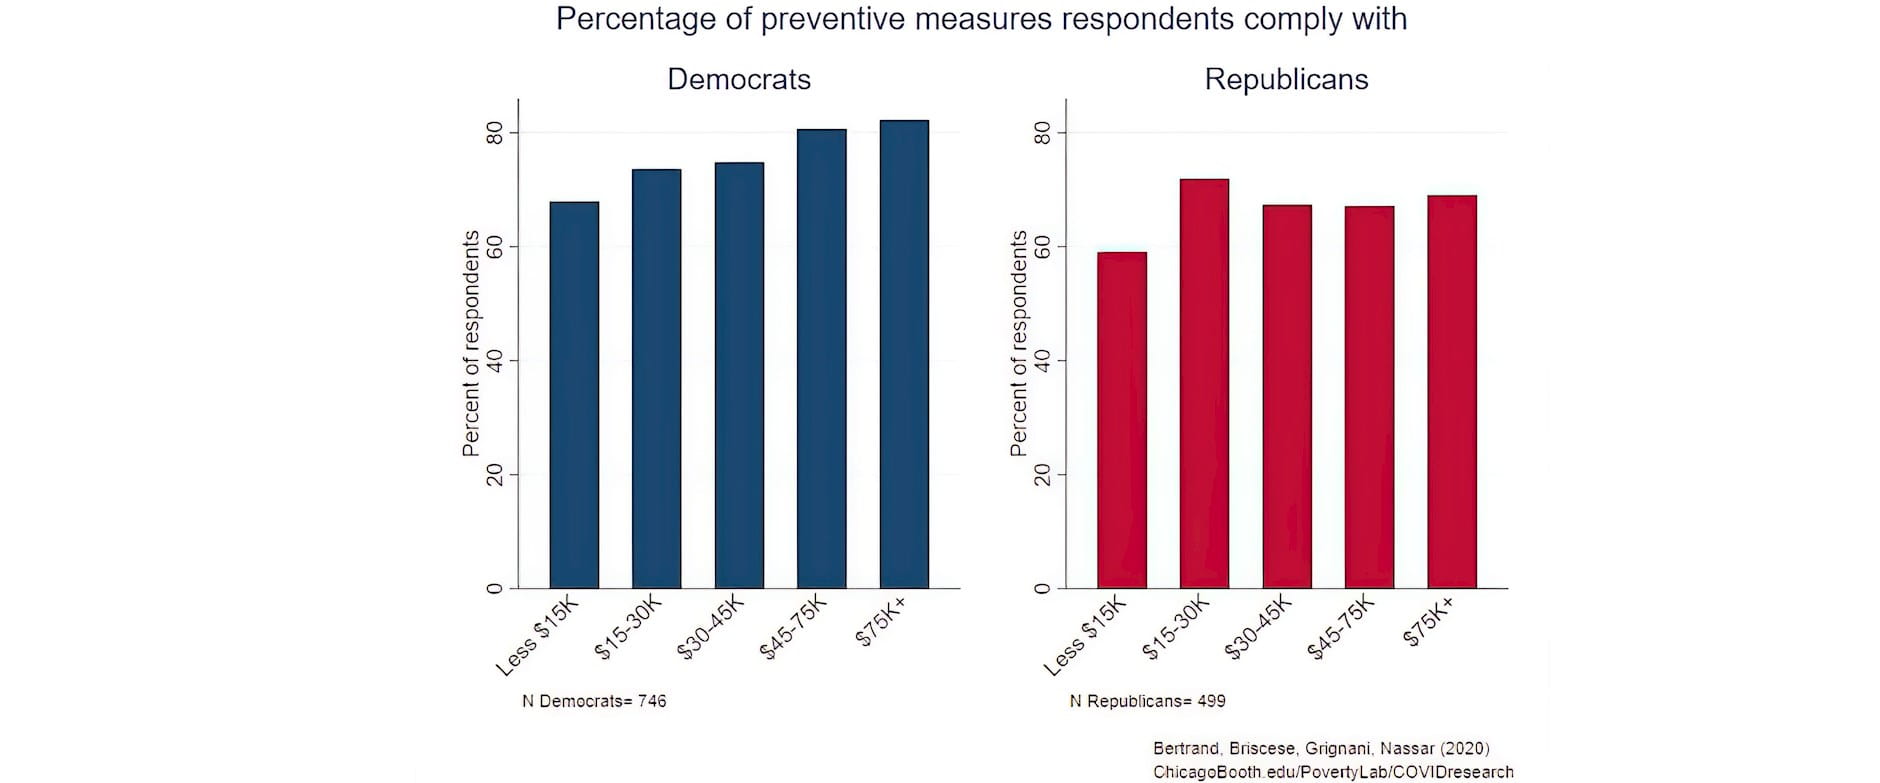
Notes: The graph shows the percentage of respondents who reported staying at home unless strictly needed, split by their political party and household income group.
When asked when they thought the physical distancing measures would be lifted, 13 percent thought by May 1, 55 percent by June 1, and 21 percent by September 1; only around 10 percent thought the measures would be lifted by the end of the year or next year.
Finding #7: Most Americans would support a nation-wide coordinated response to COVID-19, but a disapproving minority is opposed due to political mistrust
Many U.S. states are struggling to manage the burden that the coronavirus is imposing on their health-care system. At the same time, not all states and major cities have been equally impacted in terms of contagion cases and death rates. Some policymakers, including New York Governor Andrew Cuomo, have advocated for a centralized resource allocation model where medical equipment, such as ventilators, and health professionals would be assigned from less needy states to more needy ones, and then returned to the senders as the situation becomes more manageable or the sending state needs it again.
Most Americans would support temporarily lending some medical equipment and staff to another state (76 percent of Democrats and 67 percent of Republicans). The small proportion of those who disapproved of this policy (about 13 percent of Republicans and 9 percent of Democrats), state scarcity concerns as a main reason for their answer. A small but equal fraction of Democrats and Republicans opposed it because they thought it was unfair since other states implemented poor containment policies. More interestingly, Democrats were more likely to disapprove because of low levels of trust in the federal government, and Republicans because of low levels of trust with other states’ government.
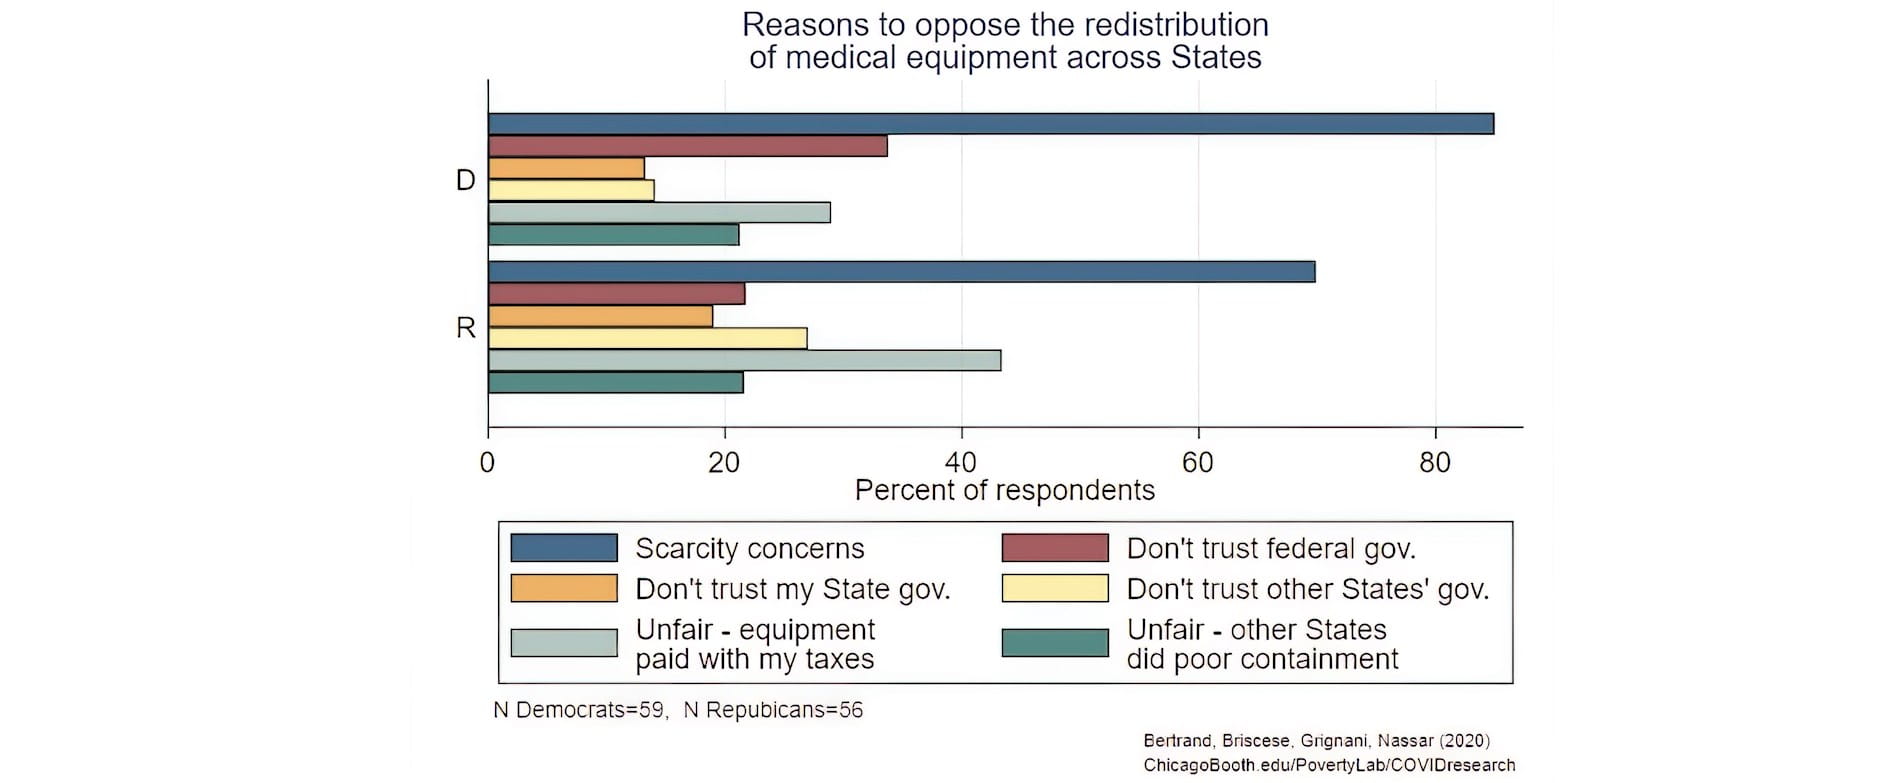
Notes: The graph shows the percentage of respondents that reported not supporting a redistribution of medical equipment across States, by reasons and political party. Respondents could select all options.
Conclusions
The preliminary insights emerging from the first wave of the longitudinal survey are showing how the economic impact of the virus has been affecting American households differently depending on their level of income, gender and race.
On the political front, Americans do not seem particularly divided by their party affiliation when it comes to their willingness to comply with preventive measures and other policies imposed by their state governments, or their support a coordinated national approach to address the crisis. However, lower-income Republicans stand out as an outlier in their willingness to comply with government policies to control the spread of COVID-19.
Check back to Rustandy's Coronavirus Social Impact Research page for the latest results. Read the press announcement.
Authors
Marianne Bertrand, Chris P. Dialynas Distinguished Service Professor of Economics, University of Chicago Booth School of Business, and Faculty Director, Chicago Booth's and UChicago’s Poverty Lab; Guglielmo Briscese, Postdoctoral Fellow, Poverty Lab; Maddalena Grignani, Research Professional, Rustandy Center; and Salma Nassar, Senior Associate Director of Research Initiatives, Rustandy Center
1Income per capita is calculated as the household income adjusted by size of household, as per OECD guidelines (source: http://www.unece.org/fileadmin/DAM/stats/groups/cgh/Canbera_Handbook_2011_WEB.pdf)

![]()
![]()