Update: Labor Market Recovery Stalls as COVID-19 Cases Surge
- By
- November 19, 2020
- Rustandy Center for Social Sector Innovation
Week 1: Labor Market Impacts of COVID-19 on Hourly Workers in Small- and Medium-Sized Businesses
Week 2: Update with Homebase Data Through April 11
Week 3 and 4: Update with Homebase Data Through April 25
Week 5 and 6: Update with Homebase Data Through May 9
Week 7 and 8: Update with Homebase Data Through May 23
The current surge in COVID-19 cases appears to be taking a toll on small businesses and their employees.
As in previous analyses, we track the impact of the pandemic on roughly 40,000 small businesses that use Homebase, an electronic time clock and scheduling service. We will continue to update these facts, tracking patterns and adding new information as the COVID-19 situation develops. An up-to-date version of this summary will be maintained here.
Finding #1: Recovery has stalled and begun backsliding. There has been little net recovery since June. In the last few weeks, we are seeing increased layoffs again.
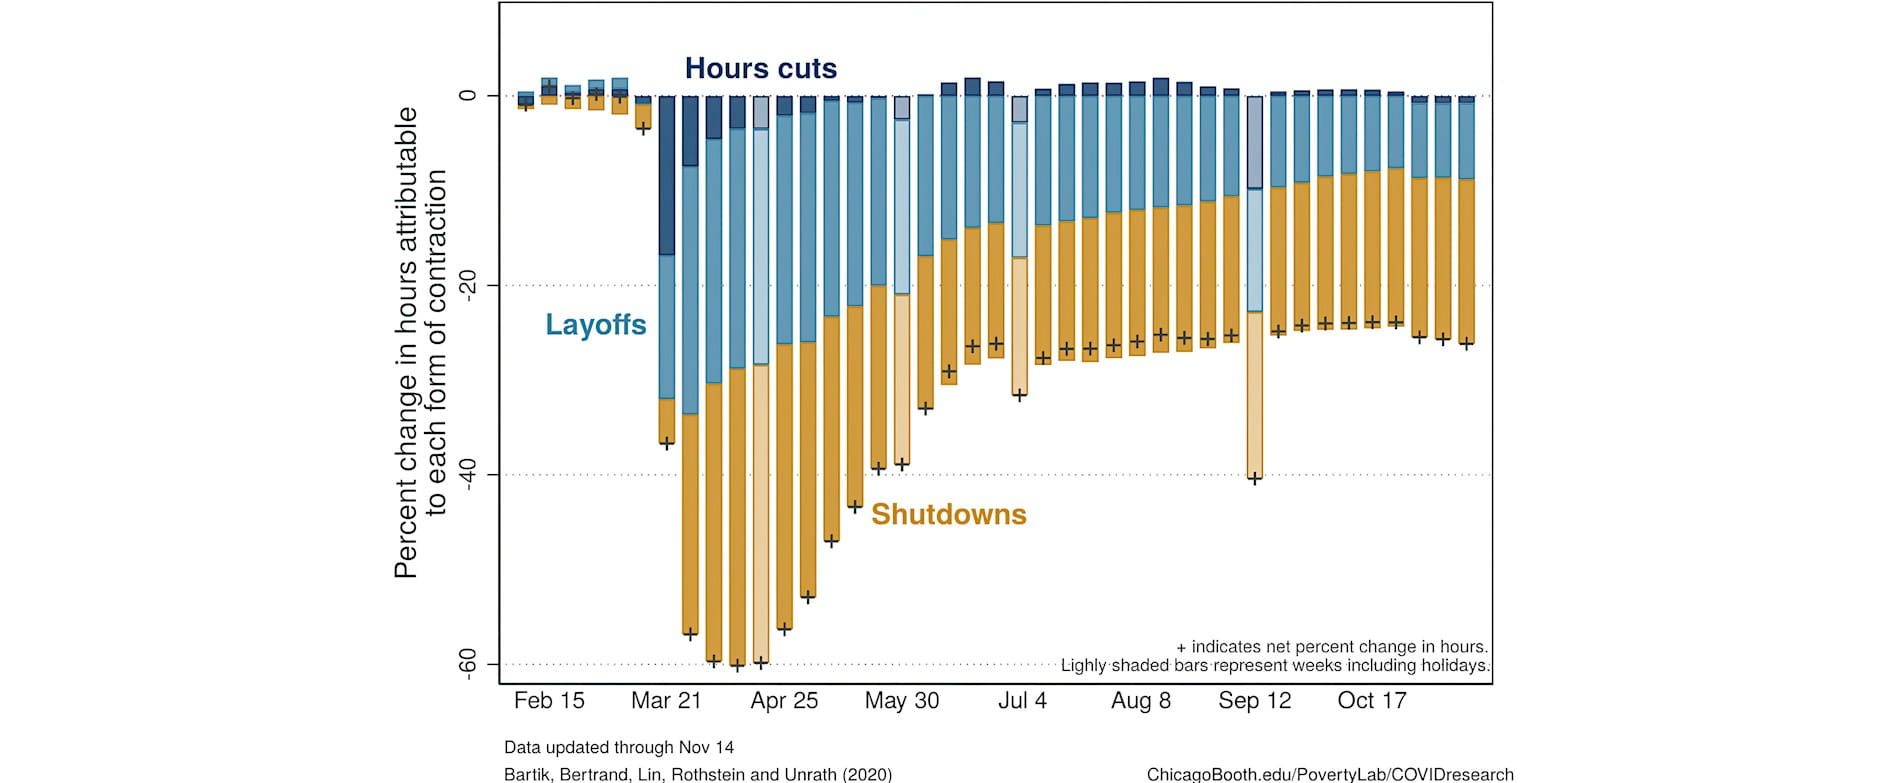
Figure 1 illustrates how aggregate hours have changed relative to late January at these firms. We distinguish between three sources of hours losses: firm shutdowns, layoffs, and hours cuts. At the height of the crisis, total hours at these businesses fell roughly 60 percent relative to their January baseline. The decline in total hours was due primarily to firms closing entirely and to open firms laying off some portion of their staff. Between mid-March and early April, about 40 percent of the businesses in our sample shut down entirely for at least one week.
Between the end of April and late June, firms gradually reopened and restored their employees’ hours. By July, this recovery flatlined. Since then, there has been neither a net reopening of previously closed firms nor hours growth among those that did reopen. Close to one-quarter of firms that shut down in March have never reopened, and a similar fraction of firms that did reopen have since closed again.
As COVID-19 case counts started to rise again in late October, total hours fell for several consecutive weeks, the first time this has happened since April. Shutdowns, layoffs, and hours cuts have all risen in each of the last three weeks.
FIGURE 1: Hours changes at Homebase firms each week, relative to Jan 19-Feb 1, decomposed into firm shutdowns, layoffs, and hours reductions
Finding #2: Some of the firms that reopened are shrinking or closing again. Most firms that have reopened did so by the end of June. In the last few weeks, some firms that had reopened closed again, and others have cut back.
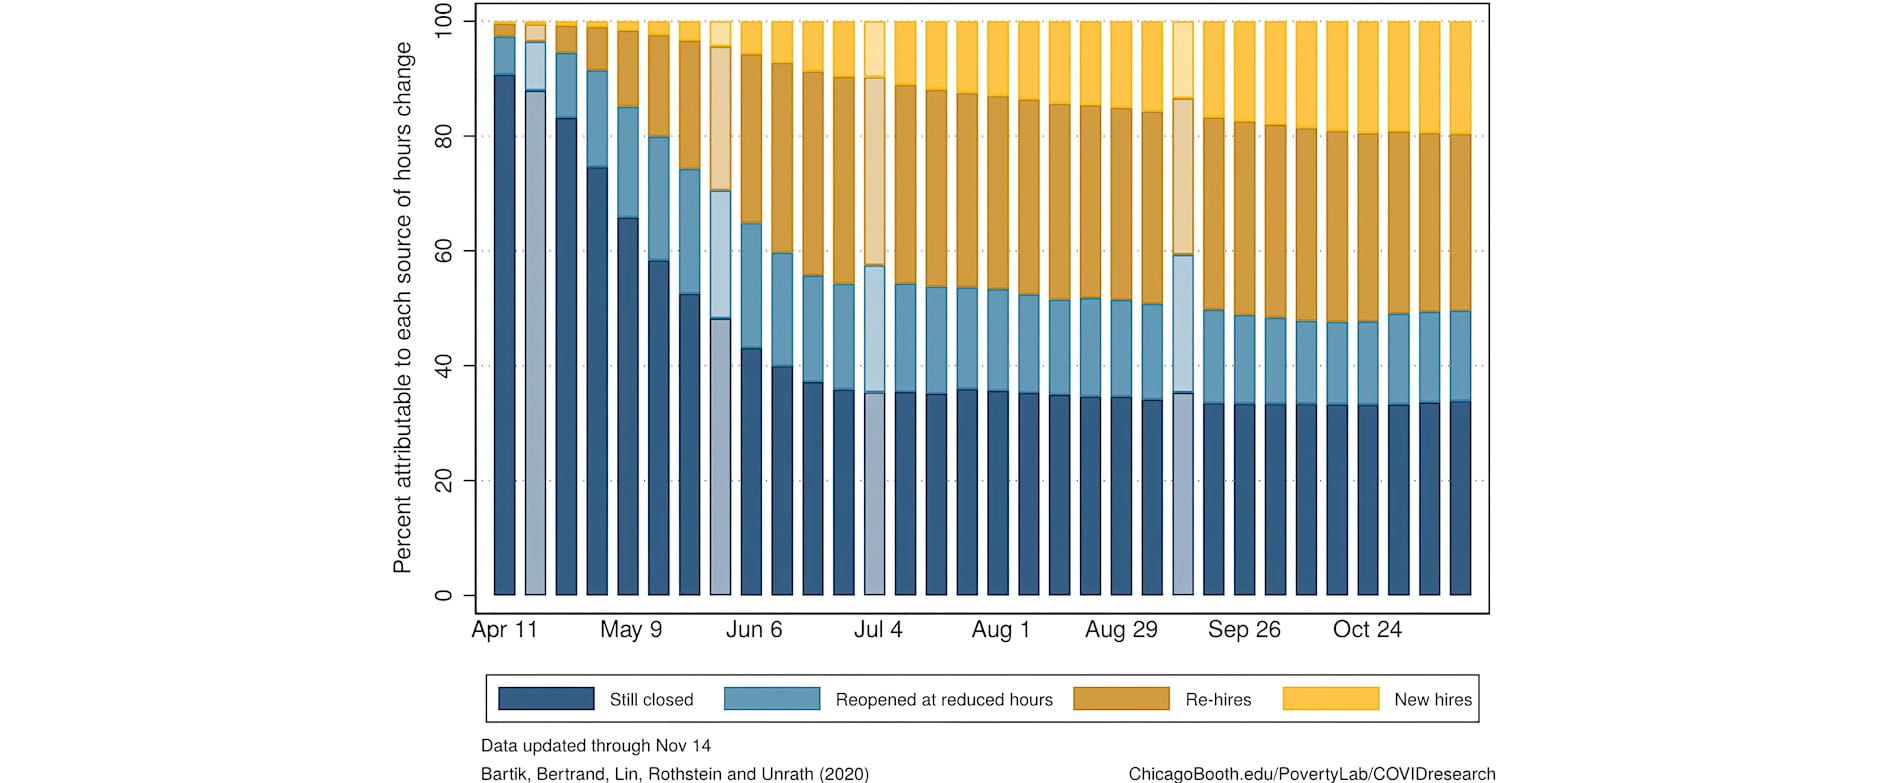
Figure 2 summarizes how hours have been restored (or are still missing) among the firms that shut down before April 4. As of the week ending November 14, these firms have restored just half of their collective baseline hours. One-third of baseline hours remain missing due to ongoing firm closures, and around 15 percent are due to reopened firms operating at reduced scale. At firms that have reopened, two-thirds of hours in recent weeks were worked by individuals employed at the firms before the crisis, and one-third by newly hired workers.
FIGURE 2: Distribution of hours, relative to Jan 19-Feb 1, among firms that shut down between March 15 and April 4
The stagnation over the summer, the recent uptick in layoffs and firm closures, and that the pace of the recovery appears to move with the COVID-19 case count are all worrying signs about our longer-term economic recovery. The current surge and growing number of new local shut down orders may heighten risks of closure for the small businesses that have managed to stay open and raise the probability that already closed small businesses never reopen.
Check back to Rustandy's Coronavirus Social Impact Research page for the latest results. Read the press announcement.
Authors
Alexander W. Bartik, Assistant Professor Economics, University of Illinois at Urbana-Champaign, and Research Affiliate, UChicago’s Poverty Lab; Marianne Bertrand, Chris P. Dialynas Distinguished Service Professor of Economics, University of Chicago Booth School of Business, and Faculty Director, Chicago Booth's Rustandy Center for Social Sector Innovation and UChicago’s Poverty Lab; Feng Lin, PhD Student, University of Chicago; Jesse Rothstein, Professor of Public Policy and Economics, University of California, Berkeley, and Director, California Policy Lab; and Matt Unrath, PhD Candidate, Goldman School of Public Policy, UC Berkeley, and Research Fellow, California Policy Lab
Acknowledgements
We thank Homebase and Ray Sandza in particular for generously allowing access to their data and sharing their time to answer questions and help us understand the data. We also thank Jingwei Maggie Li, Salma Nassar, and Greg Saldutte at Booth's Rustandy Center for Social Sector Innovation and Manal Saleh at the Poverty Lab for excellent assistance on this project and Michael Stepner for comments.

![]()
![]()
![]()