
Week 2: Labor Market Impacts of COVID-19 on Businesses: Update with Homebase Data Through April 11
- By
- April 11, 2020
- Rustandy Center for Social Sector Innovation
Week 1: Labor Market Impacts of COVID-19 on Hourly Workers in Small- and Medium-Sized Businesses
Week 3 and 4: Update with Homebase Data Through April 25
Week 5 and 6: Update with Homebase Data Through May 9
Week 7 and 8: Update with Homebase Data Through May 23
Note: The results described in Figure 4 have been retracted due to an error. Click here for the corrected, updated results. The error did not affect any of the other figures or results.
Below, we update our four figures analyzing the labor market impacts of COVID-19 on small businesses using Homebase time-card information with data through April 11. (Our previous analysis used data through March 28.)
Broadly, the patterns remain similar as before, but three features of these updated data are worth highlighting:
First, hours losses appear to have stabilized somewhat post March 28. States announcing shelter-in-place orders later than other places have not fully converged to those states announcing shelter in places earlier.
Second, there appears to be within-week variation in the effects of COVID-19 on the labor market, with the reduction in total hours worked being larger on the weekend than on weekdays. This suggests firms are disproportionately reducing weekend hours.
Third, we are more confident than we were last week that firms are primarily implementing reductions either via total shutdowns, with no workers recording positive hours in a week, or by reducing hours of all workers without substantial layoffs. This pattern showed up in Figure 4 in our post last week, but we added a caveat that it could have been a statistical artifact due to the fact that workers who had hours in the first half of the week and were then laid off would initially appear in the "hours cut" category and only appear in the correct "layoff" category in the following week. That seems not to have happened: The layoffs category grew only a small amount in the week ending April 4, and the "hours cut" category shrunk only a bit. It seems that a large share of the still-open firms have distributed hours reductions among their workers without substantial layoffs.
We will update these facts frequently to track these patterns over time and add new information as the COVID-19 situation develops. An up-to-date version of this summary will be maintained here. These analyses build upon the work done by Homebase itself on their blog, where they have provided frequent analyses on what their data is telling us about labor market developments.
Fact 1: Firms Have Dramatically Reduced Employee Hours
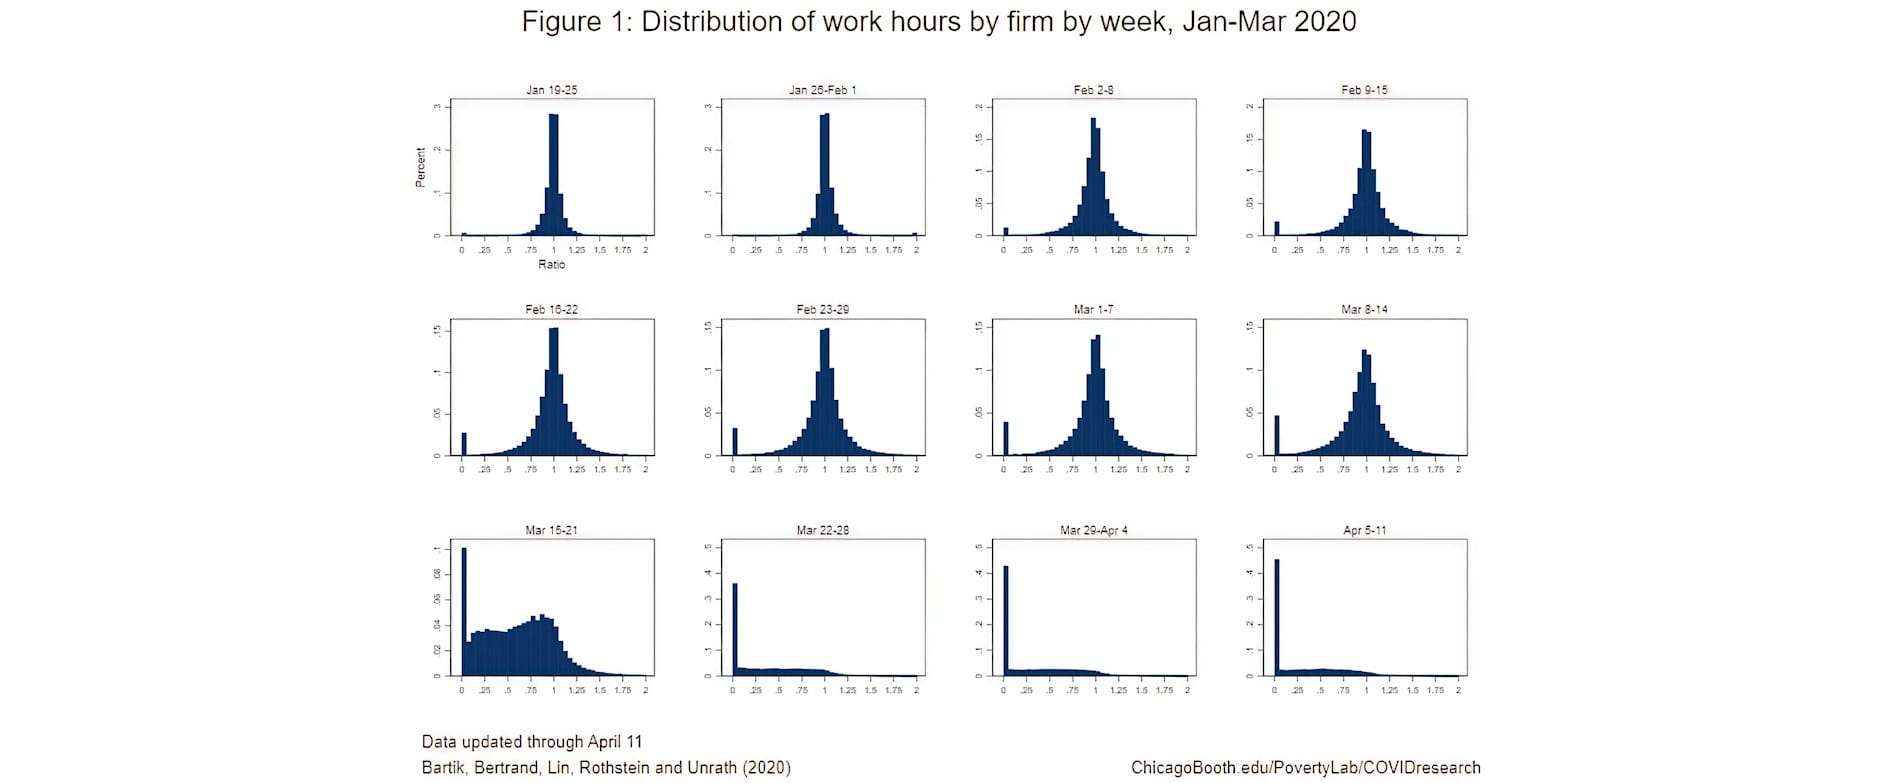
Figure 1 plots the evolution of total hours per week worked among firms in our sample from January 19 through April 4 (the last full week in the data). Each sub-plot shows the distribution of hours across firms, measuring each firm relative to its average hours per week in a base period of January 19 – February 1. Through early-March, the distribution of hours is centered around one, corresponding to stable hours worked, with a few firms shutting down (at least for the week) and reporting zero hours but little net change on average. The week of March 8, the distribution of hours starts to shift slightly left and then the week of March 15 the distribution shifts dramatically left. Most firms have significantly fewer hours than in the base period and over 15 percent of firms shut down entirely. By the week of March 29, over 40 percent of firms shut down entirely, with zero recorded hours, and many of the remaining firms having quite large reductions in hours.
Fact 2: Hours Reductions Vary by Ability of Industry to Operate Under Stay-at-home orders
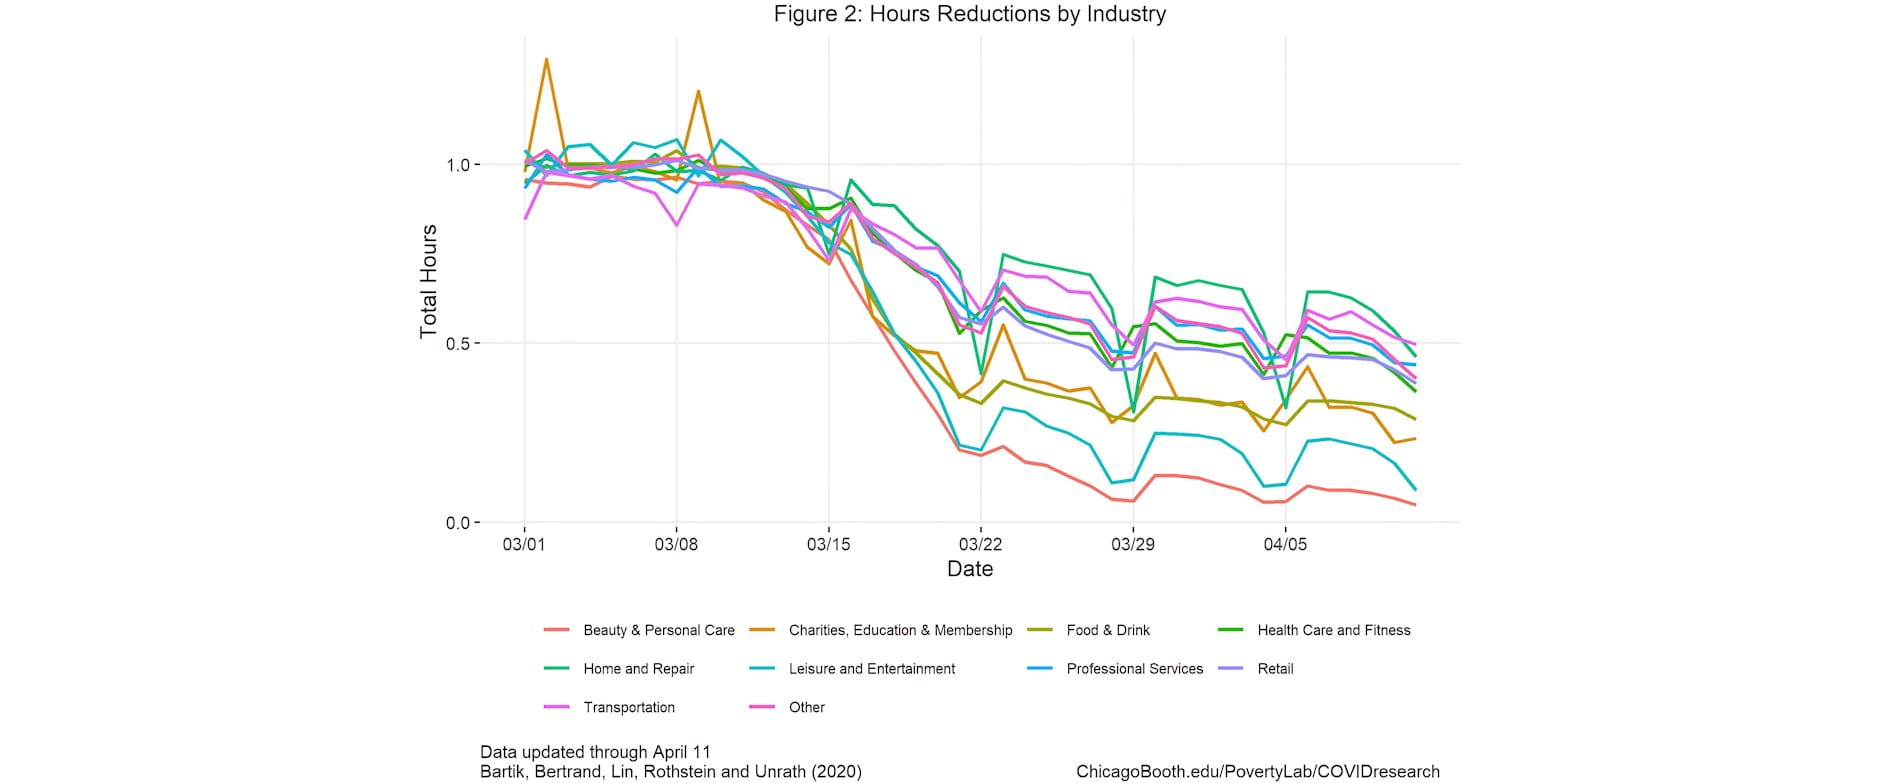
Figure 2 investigates how hours reductions vary by firm industry. We see that reductions in hours are largest in Beauty and Personal Care and Leisure and Entertainment, where hours have declined over 90 percent. Hours declines are smallest in industries like Home and Repair and Transportation. However, even in these industries hours have declined by around 50 percent. Broadly, the magnitudes of industry-level job declines appear to closely map the extent to which an industries’ workers are “essential” according to government social distancing orders, and whether consumption requires in-person interaction (i.e. whether remote work is possible).
Fact 3: Hours Start Falling Earlier in States with Stay-At Home Orders, but Start Falling Sharply by March 16 in Almost All States
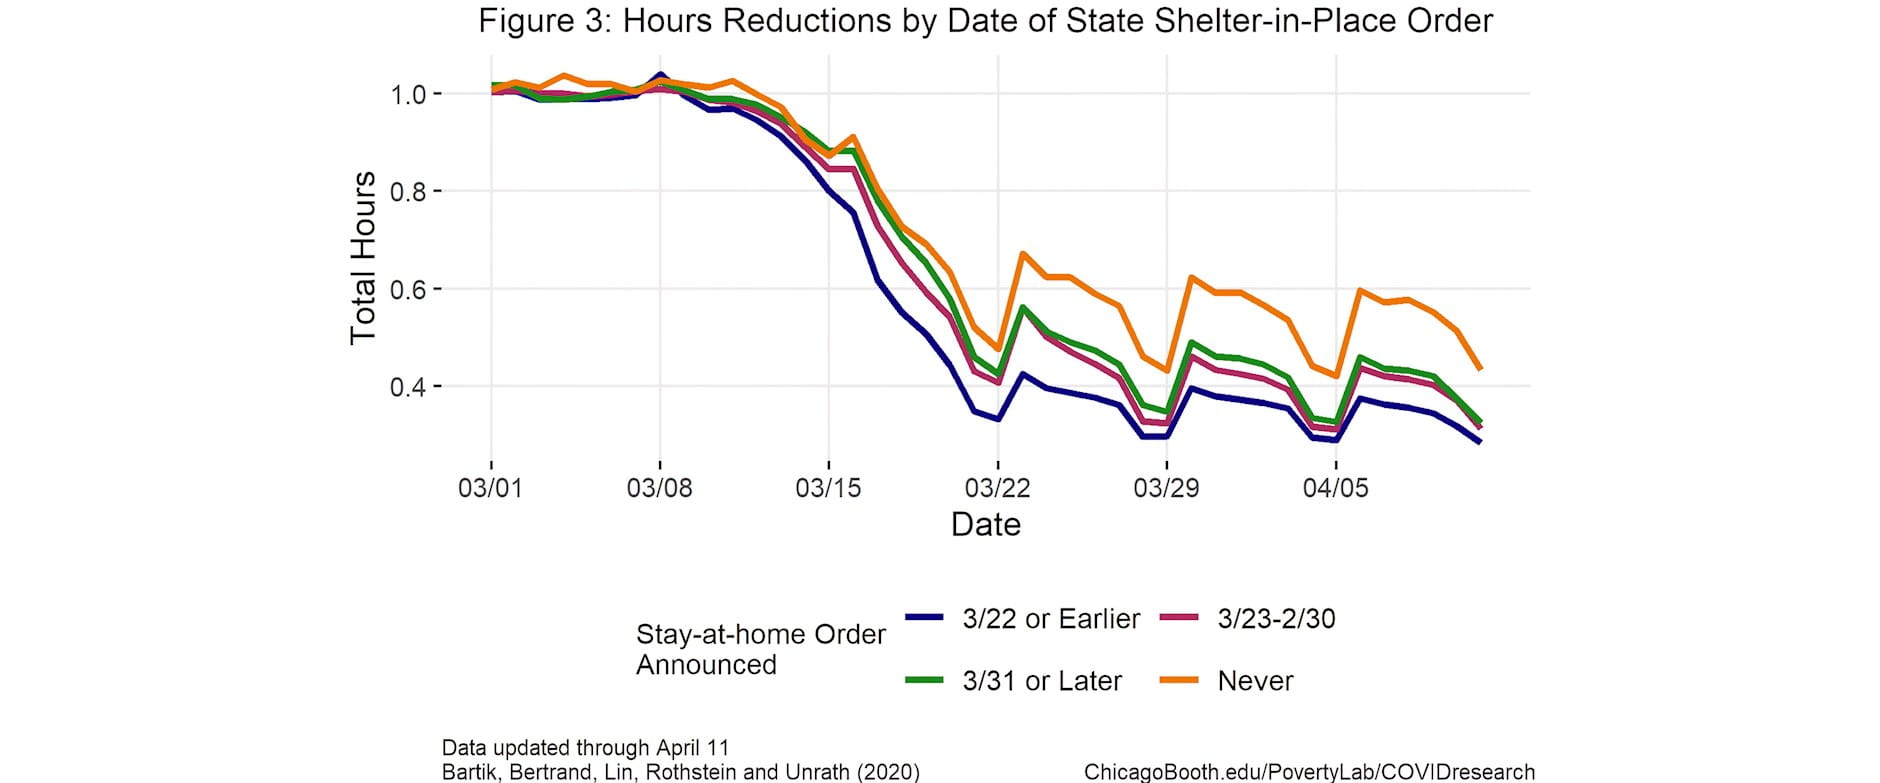
Figure 3 explores how hours reductions vary across states by the timing of the announcement of a stay-at-home or shelter-in-place order (if any). We group states into four categories, those that announced shelter in place orders on or before March 22, those that announced shelter in place orders between March 23 and March 30, those that announced shelter in place orders on March 31 or later, and those states that have yet to announce shelter-in-place or stay-at-home orders.
Fact 4: Hours Reductions are Primarily Explained by Firm Shutdowns and Hours Reductions, Not Layoffs
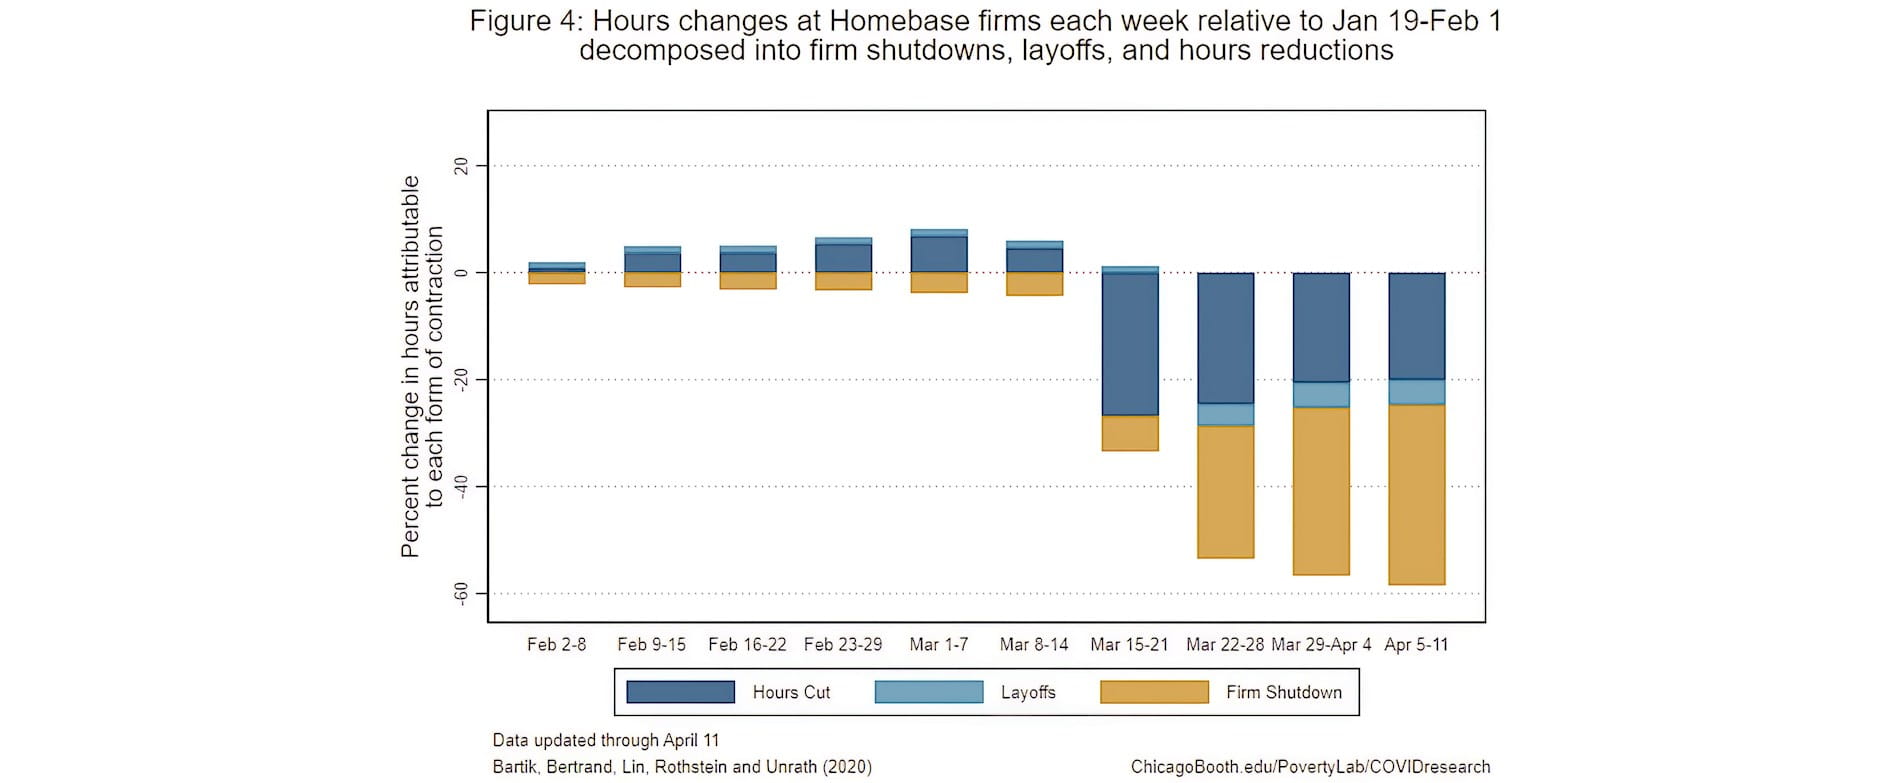
Figure 4 separates the total hours reductions documented in Figures 1 - 3 into three channels: shutdowns, layoffs, and cuts in hours. We define firms as having fully shut down in a given week if the Homebase data records zero employees clocking in at that firm during that week. We identify a worker as having been laid off in a given week if that employee works zero hours at a firm which is still operating. We define hours cuts as the reduction in hours, relative to that initial baseline, among workers still employed at still operating firms. The figure distinguishes which fraction of the percent change in hours each week since early February is attributable to these three forms of hours reductions. The total number of hours worked in the first week of April are less than half what they were in late January. Most of that reduction is due to firms fully shutting down or asking retained employees to work fewer hours. A smaller percentage is due to firms laying off a portion of their workforce. This suggests that the principal driver of unemployment claims is total firm shut downs. It also suggests that even still employed workers are suffering a cutback in their hours.
One important caveat to this decomposition is what we refer to as a firm shut-down is a shut-down of Homebase measured employment. If firms employ workers that do not schedule their time using Homebase and some of these workers remain employed, some of the hours losses that we attribute to shut-downs may instead be properly attributed to layoffs.
METHODOLOGY
Our analyses are based on data on hours worked at the establishment-worker-day level generously made available by Homebase. These data extend from January 1, 2020 through April 11, 2020.We aggregate the Homebase data to the firm-MSA-industry-day level.We restrict the sample to firms whose employees worked at least 80 hours between January 19 and February 1 and to states for which we observe at least 50 such firms. We refer to this two-week window as the “base period.” All analyses weight firms by their total hours during the base period.
In our analyses of weekly outcomes (e.g., Figures 1 and 4), we normalize each firm’s hours by dividing by the average hours worked per week over the base period at the firm. In our analyses of daily outcomes (e.g. Figures 2 and 3), we normalize by dividing by the average value of the outcome at the given firm on the same day of the week during our base period. For example, if total hours for a firm on Friday, March 13 was 100 and total hours for the same firm on Friday, January 24 and Friday, January 31 was 300, (150 on each day), the outcome variable total hours’ value would be .66. (This is 100 divided by (300/2), the average Friday hours in the base period.)
We use the data compiled by The New York Times on the timing of stay-at-home and shelter-in-place orders in different states.
Check back to Rustandy's Coronavirus Social Impact Research page for the latest results. Read the press announcement.
Authors
Alexander W. Bartik, Assistant Professor Economics, University of Illinois at Urbana-Champaign, and Research Affiliate, UChicago’s Poverty Lab; Marianne Bertrand, Chris P. Dialynas Distinguished Service Professor of Economics, University of Chicago Booth School of Business, and Faculty Director, Chicago Booth's Rustandy Center for Social Sector Innovation and UChicago’s Poverty Lab; Feng Lin, Research Professional, Chicago Booth; Jesse Rothstein, Professor of Public Policy and Economics, University of California, Berkeley, and Director, Institute for Research on Labor and Employment (IRLE) and California Policy Lab; and Matt Unrath, PhD Candidate, Goldman School of Public Policy, UC Berkeley, and Research Fellow, California Policy Lab
Acknowledgements
We thank Homebase and Ray Sandza in particular for generously allowing access to their data and sharing their time to answer questions and help us understand the data. We also thank Jingwei Maggie Li, Salma Nassar, and Greg Saldutte at Booth's Rustandy Center for Social Sector Innovation and Manal Saleh at the Poverty Lab for excellent assistance on this project and Michael Stepner for comments.

![]()
![]()
![]()