


Is COVID-19 Changing Americans’ Beliefs and Preferences?
- By
- October 21, 2020
- Rustandy Center for Social Sector Innovation
Wave 1: How are Americans Coping with the COVID-19 Crisis? 7 Key Findings from a Household Survey
Wave 2: When and How the U.S. Should Reopen is a Matter of Politics, Trust in Institutions and Media, Survey Says
July: How COVID-19 is Changing Americans' Behaviors, Expectations, and Political Views
A team of researchers at the Poverty Lab and the Rustandy Center for Social Sector Innovation at the University of Chicago in partnership with NORC at the University of Chicago, an independent, non-partisan research institution, have been administering a longitudinal survey on a representative
sample of the U.S. population since April 2020. Currently in its seventh and last wave, the survey aims to collect information about how Americans are reacting to the COVID-19 crisis, how they’re coping with physical distancing measures, and how this unprecedented crisis might be changing
their views about the economy, politics, the role of government, and the future of their country.
The COVID-19 pandemic triggered one of the largest public health and economic crises the U.S. has witnessed in recent history. Through a longitudinal survey administered from April to June to more than 1,400 Americans using a sample drawn from NORC’s probability-based AmeriSpeak Panel, which
is designed to be representative of the U.S. population, we see that the crisis caused a sharp reduction in their confidence in institutions, regardless of whether they have been directly impacted. The crisis has also widened the pre-existing large gap between Democrats and Republicans on their
support for the role of government in the economy. Changes in support for government interventions are driven by political identity and media consumption, rather than personal experiences with the virus or the economic crisis.
Large scale crises have been proven to affect people’s views on the role of government in the economy, increasing support for redistributive policies, especially among younger generations (1, 2). However, what factors drive such changes remains an open question. The COVID-19
pandemic has been a global historical event that might have already triggered profound societal changes. In the United States, in particular, the increase in COVID-19 cases and deaths has occurred at a time of high political tensions with multiple events continuing to unfold, including the
upcoming presidential election. Throughout this year, most Americans have been affected, directly or indirectly, by experiences that might have influenced their beliefs. At the same time, individuals have a tendency to interpret reality in a way that confirms their prior beliefs, potentially
reinforcing, rather than changing them.
The wealth of data we have collected since April allows us to disentangle the many types of shocks respondents have lived through, including whether they suffered a financial shock, whether they know anyone hospitalized with COVID-19, or if they live in an area that has recorded a high number of
deaths from the virus or has been more impacted economically. Further, the data we collected on respondents’ media diets enables us to understand whether politically biased information mitigates or reinforces changes in people’s beliefs.
Finding 1: Americans have reduced their confidence in people running several institutions, especially in hospitals and health-care professionals. Republicans recorded the largest drop in confidence in the scientific community, while Democrats lost confidence in banks and financial institutions.
Between the beginning of April and the middle of June (our first and sixth, latest, survey wave respectively), the institutions that suffered the largest drop in trust are the scientific community, hospitals, and health-care professionals (from 58 percent to 47 percent, and from 70 percent to 50 percent respectively). However, confidence in the scientific community diminished substantially more among Republicans, with a drop of over 20 percentage points (from a baseline of 51 percent). Among Democrats, the largest drop in confidence is in the White House (from 4 percent to 1 percent), and in banks and financial institutions (from 19 percent to 10 percent), suggesting that the respondents were attentive to the actions taken in response to the pandemic by the people running these institutions.
A possible explanation for these variations in trust along party lines is the fact that some institutions, such as the scientific community, have been politicized since the first months of the pandemic, leading respondents to judge them also through political lenses. This is supported by our econometric analyses, where we see that among Republicans, those who consume partisan news sources are significantly more likely to have decreased their confidence in the scientific community (from an initial support of 50 percent to 20 percent) compared to those who consume less biased media (who shifted from 56 percent, to 41 percent).
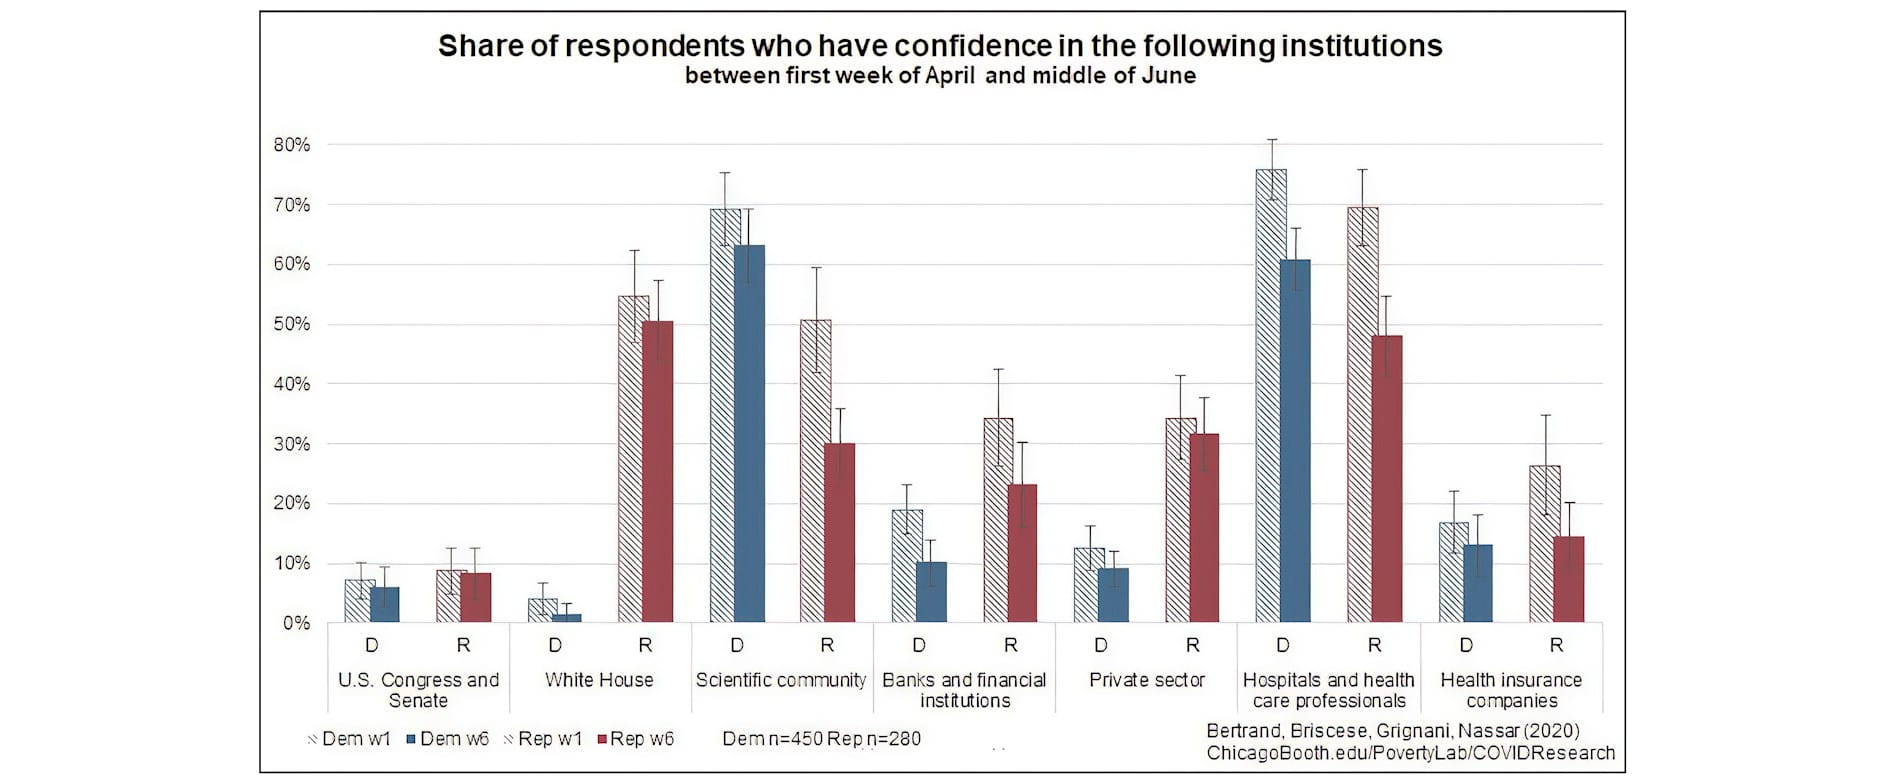
Figure 1. The chart shows the share of respondents who have a “great deal” or “complete” confidence in the institutions. Bars with stripe pattern refer to responses obtained in the first wave of the survey (in the first week of April), while solid bars show the responses from the sixth wave of the survey (third week of June). For easier reference, we omitted responses from Independents in the chart.
Finding 2: Americans have only marginally changed their views on what should be the role of government in the economy. These changes are more driven by political identity than personal experiences with the crisis.
While confidence in institutions has dropped among most Americans, they are not necessarily more opposed to a greater role of the government in the economy. Between the first and last week of April 2020, we track preferences for government intervention across a broad range of policy areas. We find that, while Democrats already favored a larger role for the government in the economy at the beginning of the crisis, by the end of April they further increased their support for policies such as guaranteed basic income (from 68 percent to 75 percent), and support for industry (from 68 percent to 74 percent). Among Republicans, the largest change has been a decrease in support for providing a standard of living to the elderly and the unemployed (from 79 percent to 66 percent, and from 50 percent to 40 percent, respectively). In sum, we find that support or opposition for government intervention changed over a short period of just four weeks, and mostly along party lines.
Through a series of additional analyses, we find that direct shocks from the crisis play a substantially less relevant role in changing people’s beliefs. We do not find statistically significant discrepancies in higher or lower support for certain policies among those who suffered a financial loss due to the crisis or have been more affected by the virus (i.e. whether they know anyone who has been hospitalized with COVID-19).
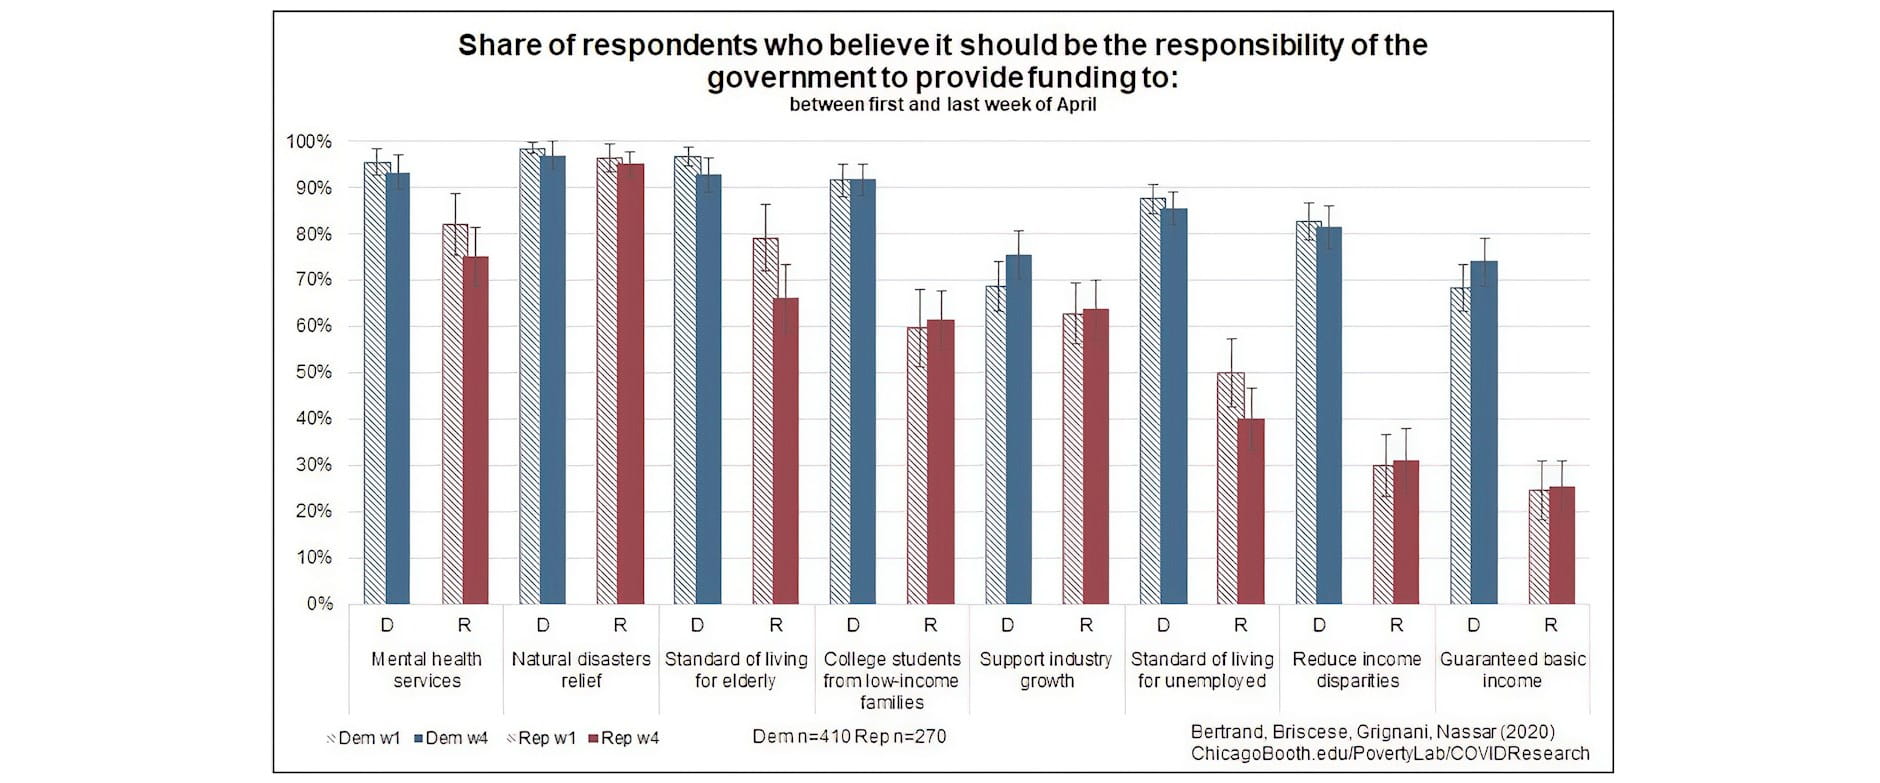
Figure 2. The chart shows the share of respondents who responded “Definitely should be” or “Probably should be” to the question “Do you think the following should or should not be the government’s responsibility to:” across the shown categories. Bars with stripe pattern refer to responses obtained in the first wave of the survey (in the first week of April), while solid bars show the responses from the fourth wave of the survey (last week of April). For easier reference, we omitted responses from Independents in the chart.
Finding 3: The U.S. health-care system has been closely scrutinized during the COVID-19 pandemic. In our survey we track Americans’ support for a universal health-care system and find that there is a net increase in support among both parties, regardless of personal experiences with the crisis.
In our analyses we identify two main types of shocks - health and financial - and whether these shocks have been affecting respondents directly or indirectly between the beginning and the end of April. In the health domain, we asked respondents whether they personally knew anyone who has been hospitalized with COVID-19 (which we found affected roughly 20 percent of our sample), and also tracked the COVID-19 death rate per thousands of inhabitants in their county of residence as a measure of indirect shock. In the financial domain, we track whether respondents incurred any financial loss (e.g. if the respondent or anyone in their immediate family had to take a payday loan, sell an item at a pawn shop, or whether they missed a mortgage or a credit card payment, which affected about 25 percent of our respondents) and if they live in an area that has struggled to recover from the initial shock. (3)
The role of financial shocks in supporting a Universal Health-care System. We find that respondents who have incurred a financial shock are more likely to have increased their support for a universal health-care system, regardless of the political party, although not in a statistically significant way (from 67 percent to 73 percent among Democrats and 18 percent to 24 percent among Republicans within this group). Living in an area that was more economically affected increased support among Democrats but not among Republicans (from 76 percent to 80 percent and from 15 percent to 11 percent, respectively).
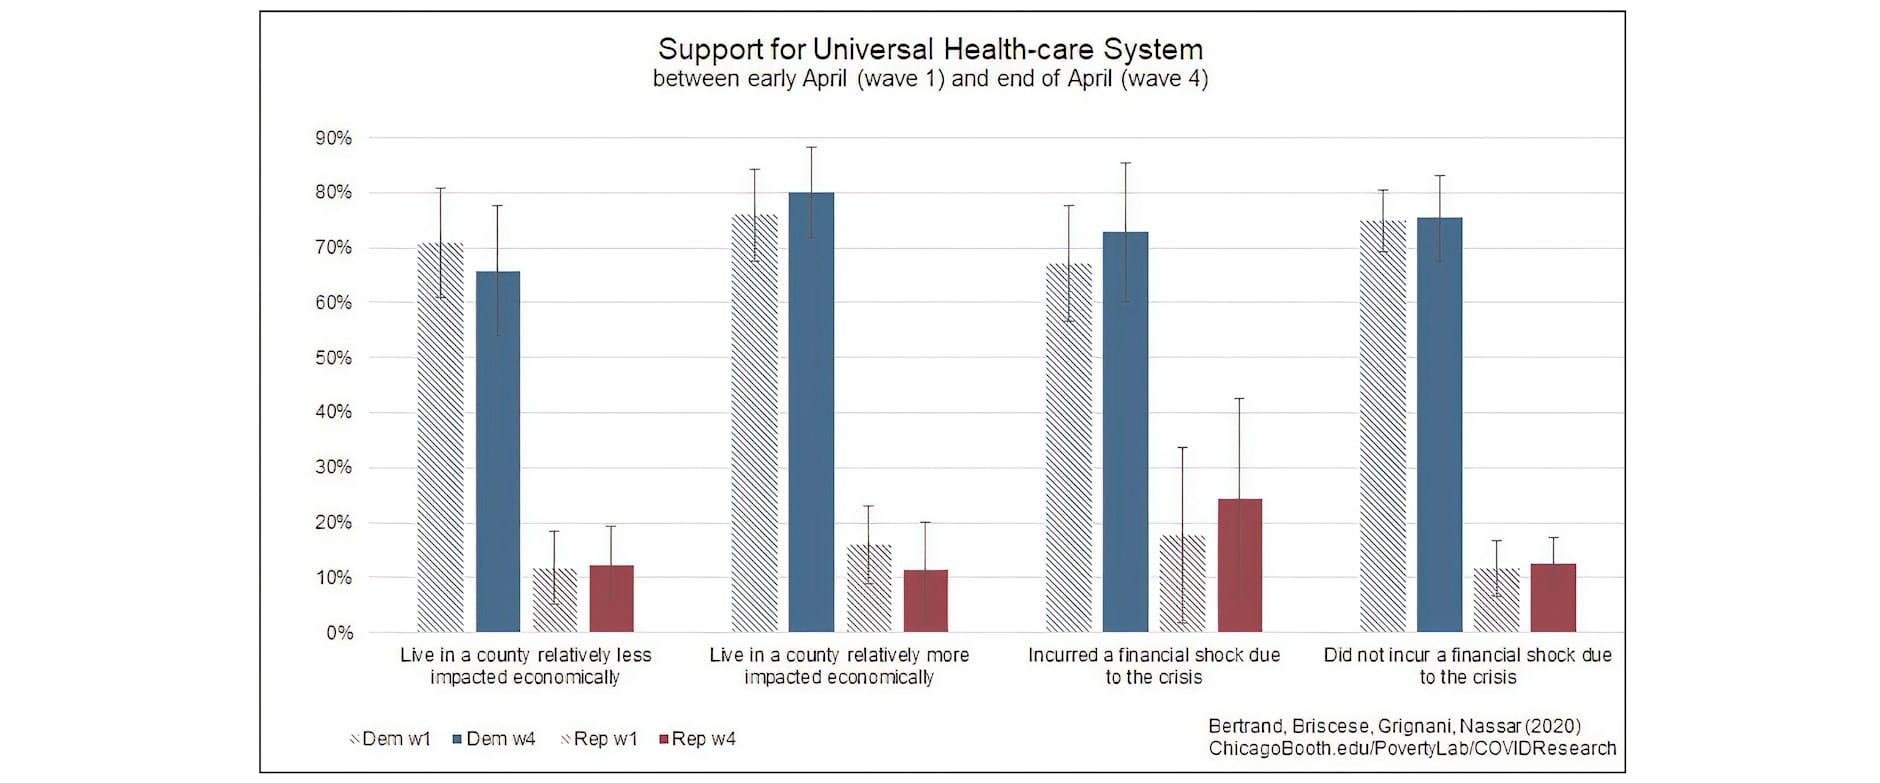
Figure 3. The chart shows the share of respondents who responded “Strongly favor” or “Favor” to the question “Do you favor or oppose a universal health-care system covered by the government so that every American can have equal access to healthcare, even if this means that you will have to pay higher taxes?”. Bars with stripe pattern refer to responses obtained in the first wave of the survey (in the first week of April), while solid bars show the responses from the fourth wave of the survey (last week of April). For easier reference, we omitted responses from Independents and sample sizes in the chart, which are the following: Less impacted economically n=171 for Democrats and n=143 for Republicans; More impacted economically n=196 for Democrats and n=99 for Republicans; Incurred financial shock n=89 for Democrats and n=53 for Republicans; Did not incur a financial shock due to the crisis n=296 for Democrats and n=210 for Republicans.
The role of health shocks in supporting a Universal Health-care System. Health shocks, whether direct or indirect, seem to play an even less important role in changing people’s views on the introduction of a universal health-care system in the U.S. compared to respondents’ political ideology.
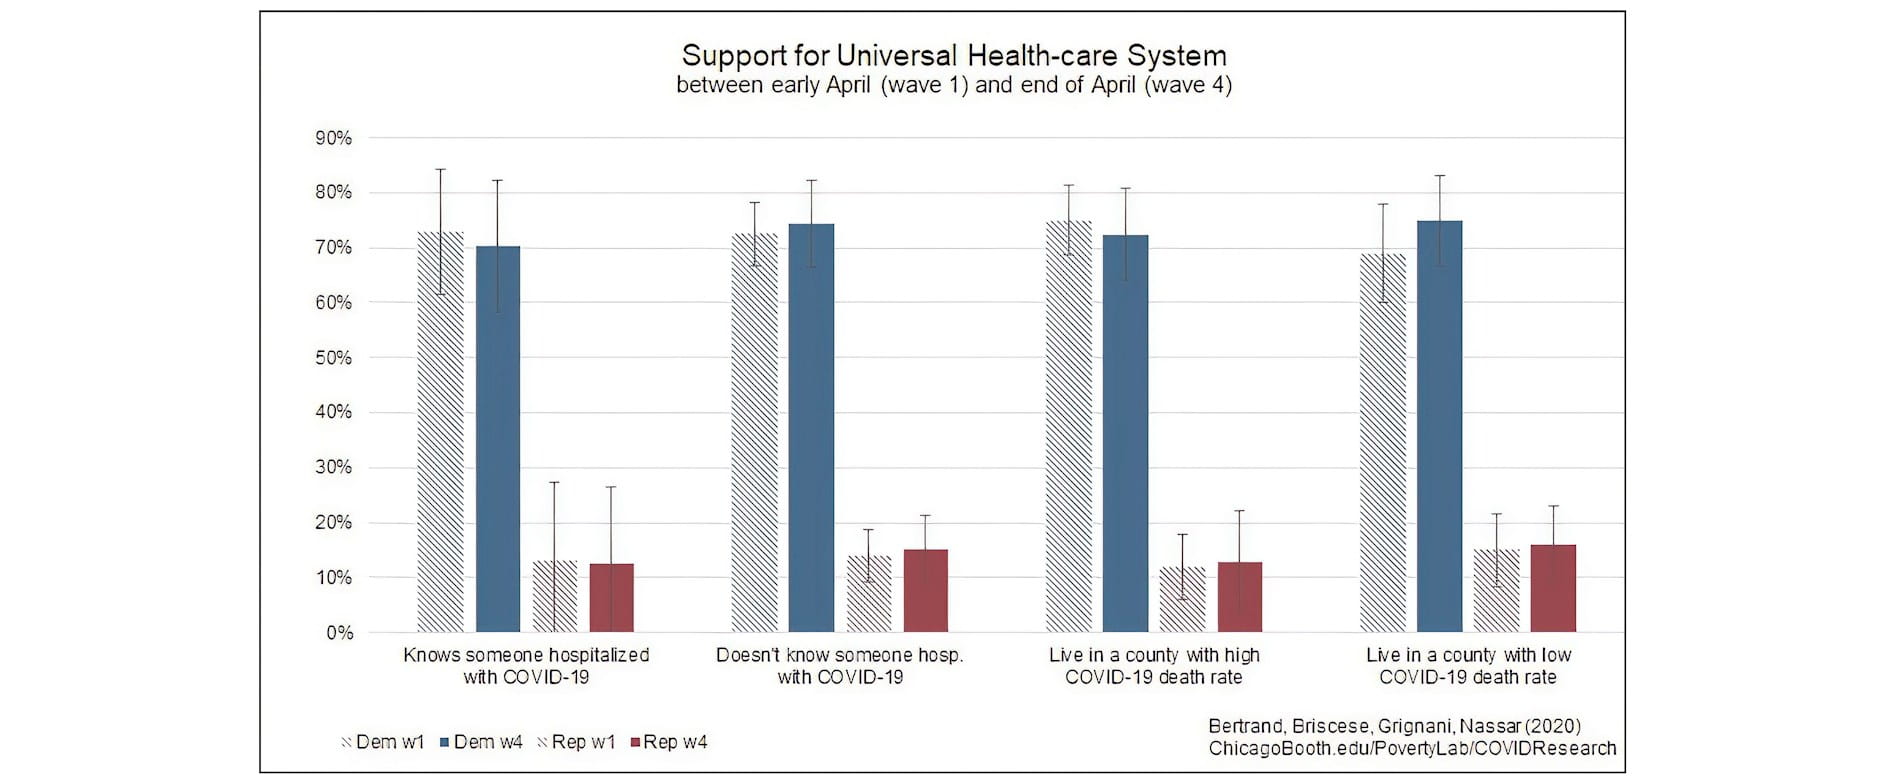
Figure 4. The chart shows the share of respondents who responded “Strongly favor” or “Favor” to the question “Do you favor or oppose a universal health-care system covered by the government so that every American can have equal access to healthcare, even if this means that you will have to pay higher taxes?”. Bars with stripe pattern refer to responses obtained in the first wave of the survey (in the first week of April), while solid bars show the responses from the fourth wave of the survey (last week of April). For easier reference, we omitted responses from Independents and sample sizes in the chart, which are the following: Knows someone hospitalized n=97 for Democrats and n=45 for Republicans; Doesn't know someone hospitalized with COVID-19 n=317 Democrats and n=226 for Republicans; Live in a county with high Covid-19 death rate n=231 for Democrats and n=182 for Republicans; Live in county with a high COVID-19 death rate per thousands of inhabitants n=112 for Democrats and n=159 for Republicans.
Finding 4: Support for government spending on temporary economic relief programs remains divisive along party lines, but the gap in partisan support is smaller compared to more long-term government interventions in the economy.
We further investigate whether support for government intervention is susceptive to the nature of the policy - that is, whether it consists in a one-off economic relief spending in response to COVID-19 as opposed to comprehensive welfare reforms. It is possible that resistance to government spending, such as the introduction of a universal health-care system, is stronger than the one faced by public expenditure on relief measures because the first one is perceived as irreversible or too politicized. When asked about government spending on programs to counteract the negative shocks caused by COVID-19, political affiliation remains a strong predictor for support or opposition, although it seems less polarizing than for the policies presented above. For instance, in the last week of April, 85 percent of Democrats and 40 percent of the Republicans believed that it was a government’s responsibility to provide for the unemployed (i.e. a 45 percent partisan gap), compared to the share of those who supported spending to help families and businesses during the lockdown (72 percent for the Democrats and 47 percent for the Republicans, i.e. a 27 percent partisan gap).
As per previous analyses, we study whether being impacted by the crisis affects respondents’ opinions. If policy preferences were driven by self-interest, we would expect individuals hit by the crisis to be more in favor of public spending regardless of their political affiliation. Instead, we find that party remains the strongest predictor for support also for coronavirus-related policies, while personal experiences do not play an important role. Respondents were slightly more in favor of financially supporting families and businesses until the end of the lockdown if they incurred a financial shock in the first week of April, regardless of their political party, but this difference is not statistically significant (Figure 5). Similarly, we do not find significant differences in support for relief policies when respondents know someone who has been hospitalized with COVID-19 (Figure 6).
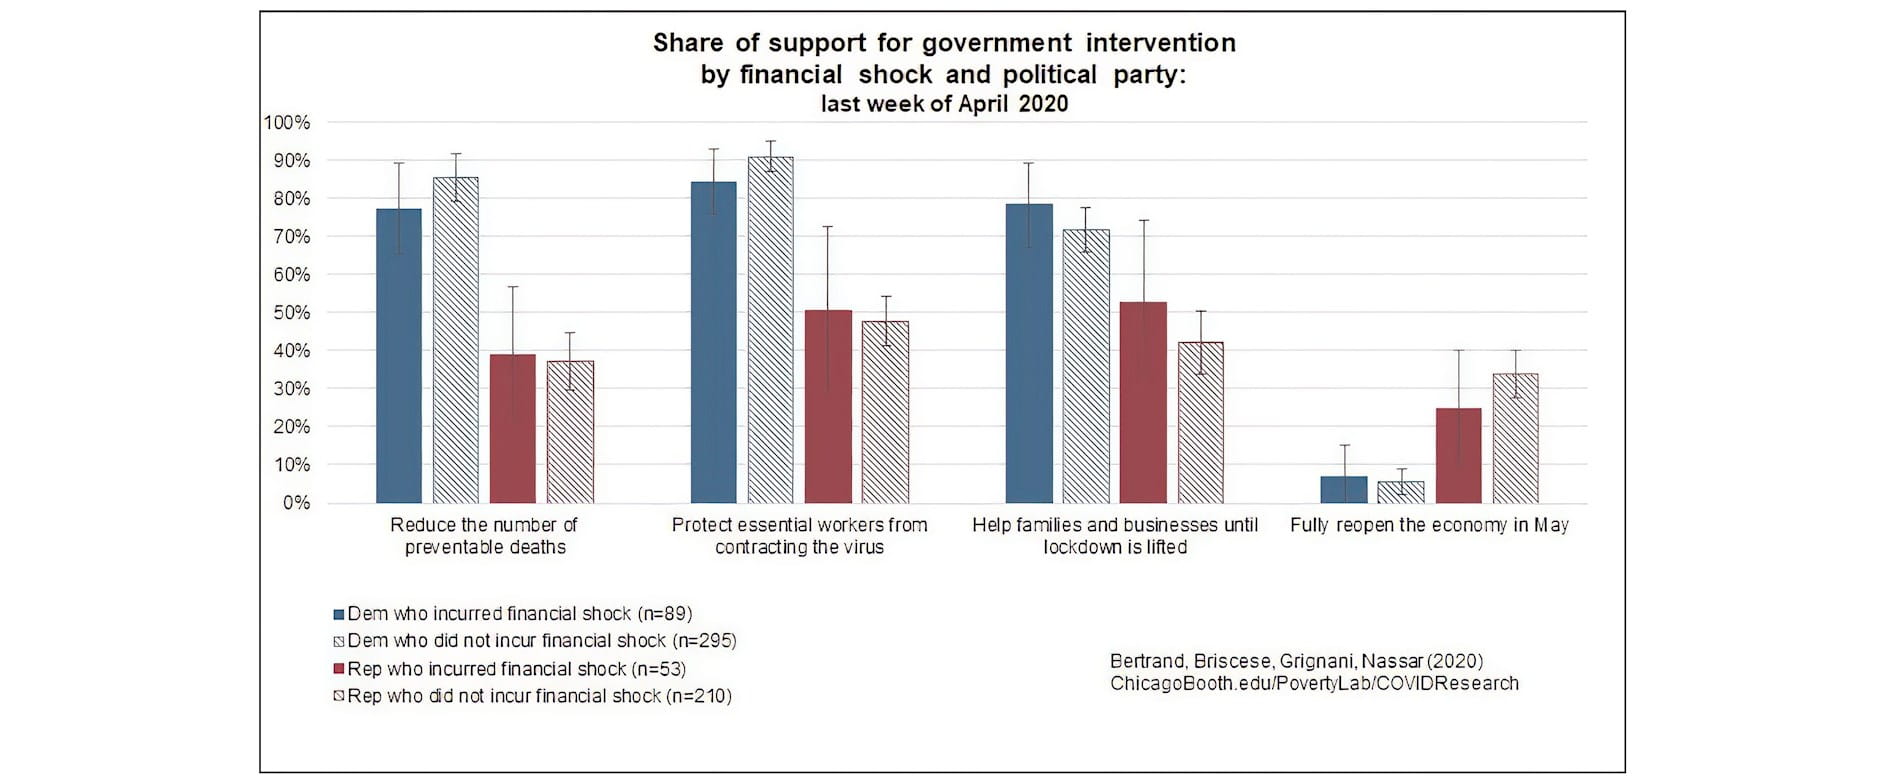
Figure 5.The chart shows the share of respondents who agreed or strongly agreed with the shown statements in the fourth wave of the survey (in the last week of April). The chart shows the share of respondents broken down by party, namely Democrats and Republicans, and by whether they incurred a financial shock or not.
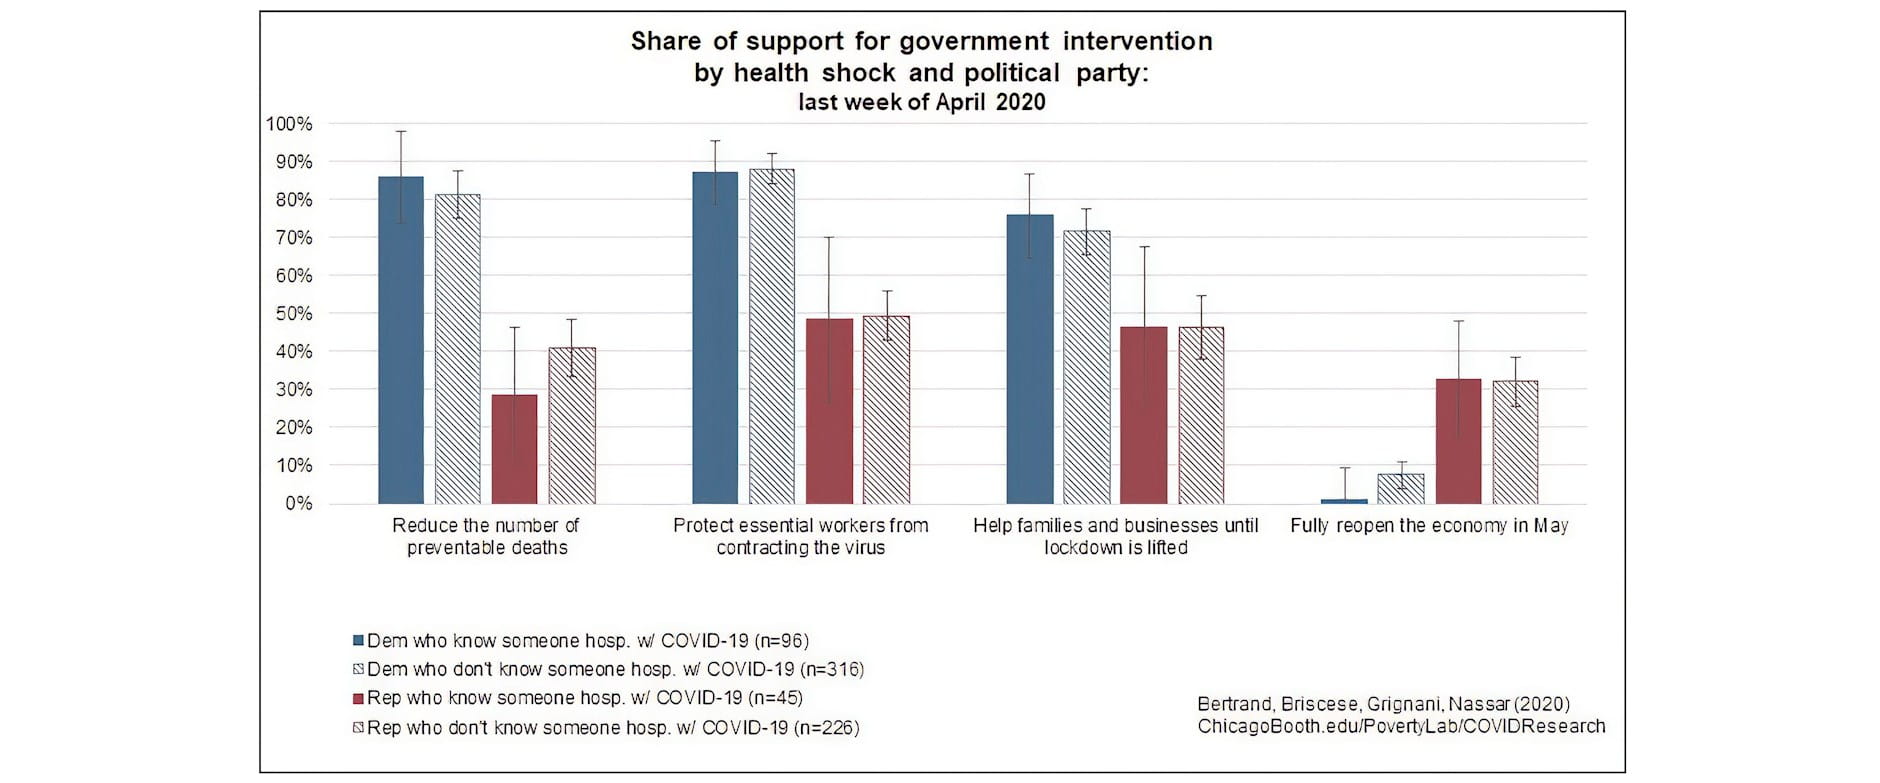
Figure 6. The chart shows the share of respondents who agreed or strongly agreed with the shown statements in the fourth wave of the survey (in the last week of April). The chart shows the share of respondents broken down by party, namely Democrats and Republicans, and by whether they know someone who was hospitalized with COVID-19 by the last week of April.
Finding 5: Political differences in the U.S. have also increased with regard to personal beliefs, in particular on whether respondents believe that success in life depends more on luck than hard work, which is correlated with support for redistributive policies.
Previous studies indicated that preferences for redistributive policies are partly influenced by whether a person’s locus of control can be considered as “external” or “internal” - that is, whether a person believes that success in life depends more on luck than hard work. This measure was first suggested by the psychologist Rotter (4) (1954) and has been used extensively in the social sciences, including in the study of political identity (Sweetser (5), 2014).
As in the General Social Survey (GSS), we asked respondents in early April (wave 1) and again in the middle of June (wave 6) whether they believed that success in life is mainly due to luck, efforts, or both. We find that, over a period of just 10 weeks, Democrats and Independents have decreased their internal locus of control, whereas the opposite is true among Republicans. While at the beginning of the crisis, 45 percent of Democrats believed that success was due to hard work, that share decreased to 41 percent by the middle of June, compared to 71 percent and 73 percent of Republicans. In a series of regression analyses, we find that having undergone a financial setback, and residing in a county that has witnessed a large increment in deaths significantly increased the chances of shifting towards believing that luck plays a larger role in influencing success in life.
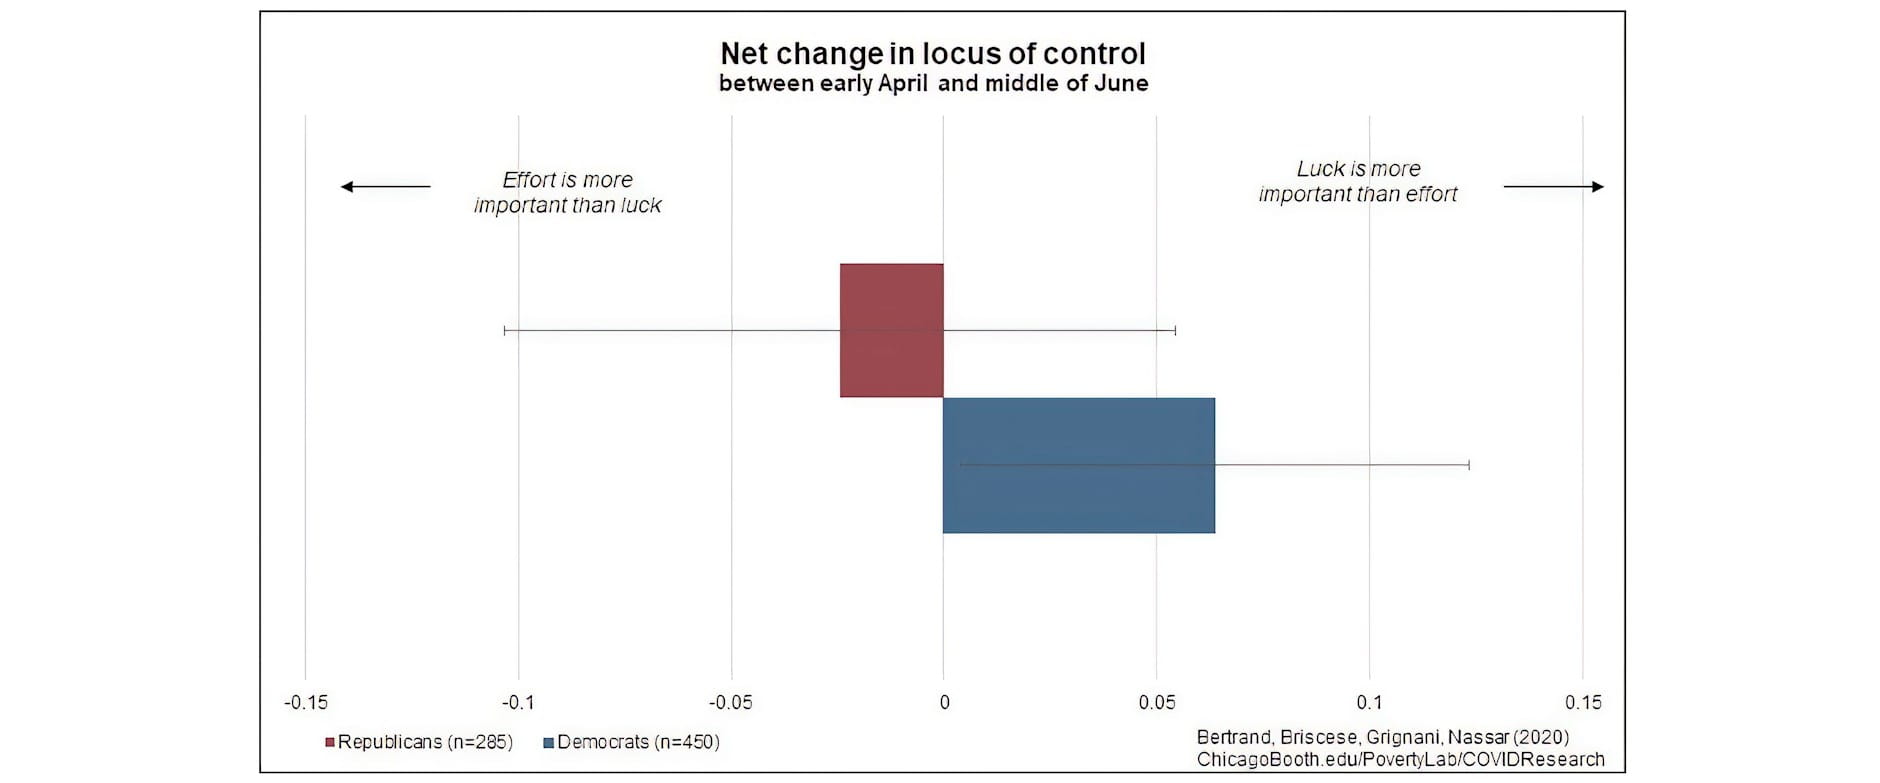
Figure 7. The chart shows the net share of respondents who shifted their locus of control from internal to external. The net change is calculated as the overall variation in share of respondents who shifted from internal to external and the share of those who shifted in the opposite direction.
Conclusions
The COVID-19 pandemic has caused one of the most profound public health and economic crises in U.S. history. Similar shocks, such as macroeconomic crises, have been proven to change people’s beliefs and views on a broad range of issues. We find that over a period of just four weeks, Americans have reduced their confidence in some institutions. This drop is exacerbated by political views and biased media consumption. At the same time, support for government spending either remained stable or changed along the lines of political affiliation over a period of 10 weeks, with Democrats being marginally more in favor of a greater role of government in the economy and Republicans slightly less. The partisan gap is smaller although still large in the support for temporary economic relief programs. We find that changes in beliefs follow political identity patterns also when it comes to personal circumstances, such as one’s locus of control. Overall, financial or health shocks, whether direct or indirect, play a small role in changing people’s beliefs compared to their political identity. We will continue to track changes in beliefs and support for policies across multiple dimensions in the final wave of the survey going into the field this week, aimed at further identifying the impact of COVID-19 on American households.
Check back to Rustandy's Coronavirus Social Impact Research page for the latest results. Read the press announcement.
Authors
Marianne Bertrand, Chris P. Dialynas Distinguished Service Professor of Economics, University of Chicago Booth School of Business, and Faculty Director, Chicago Booth's Rustandy Center for Social Sector Innovation and UChicago’s Poverty Lab; Guglielmo Briscese, Postdoctoral Fellow, Poverty Lab; Maddalena Grignani, Research Professional, Rustandy Center; and Salma Nassar, Director of Research Initiatives, Rustandy Center
(1) Piketty, T., 1995, “Social Mobility and Redistributive Policies,” Quarterly Journal of Economics, Vol. 110 (3), pp. 551–584.
(2) Giuliano, Paola, and Antonio Spilimbergo. "Growing up in a Recession." Review of Economic Studies 81, no. 2 (2014): 787-817.
(3) To measure economic impact at the zip code level we use Opportunity Insights economic tracker data, which provides the weekly change in average consumer credit and debit card spending, indexed to January 4-31, 2020 and seasonally adjusted, based on data from Affinity Solutions.
(4) Rotter, Julian B. 1966. “Generalized Expectancies for Internal versus External Control of Reinforcement.” Psychological Monographs 80 (1): 1–28.
(5) Sweetser, Kaye D. 2014. "Partisan personality: The psychological differences between Democrats and Republicans, and independents somewhere in between." American Behavioral Scientist 58(9): 1183-1194.

![]()
![]()