

How COVID-19 is Changing Americans’ Behaviors, Expectations, and Political Views
- By
- July 08, 2020
- Rustandy Center for Social Sector Innovation
Wave 1: How are Americans Coping with the COVID-19 Crisis? 7 Key Findings from a Household Survey
Wave 2: When and How the U.S. Should Reopen is a Matter of Politics, Trust in Institutions and Media, Survey Says
Since the beginning of April, we have been following the same representative sample of Americans in a series of regular surveys. The longitudinal nature of the project allows us to not only track whether Americans’ views are changing, but also what might be driving such changes. We find that, while strong divisions persist across party lines, personal experiences with COVID-19, such as having lost income because of the pandemic, may affect views and preferences among Americans.
Researchers at the Poverty Lab and the Rustandy Center for Social Sector Innovation at the University of Chicago are conducting this longitudinal survey in partnership with NORC at the University of Chicago, an independent, non-partisan research institution. Below we summarize some findings from waves one through five (conducted from April 6 through May 18). The findings refer to different time frames according to the questions analyzed. Surveys are administered to the same sample of more than 1,400 Americans based on NORC's probability-based AmeriSpeak Panel, which is designed to be representative of the U.S. population.
The project consists of a total of seven survey waves beginning in April 2020 and ending in November 2020. We will continue to share our findings in subsequent posts until the end of the year.
A loss of income due to the pandemic led many to admit that COVID-19 crisis is worse than they expected, with this effect mitigated by the choice of news source.
In the first wave of the survey (week commencing - from now on “w/c” - on April 6), 35 percent of Republicans reported that the media was exaggerating the threat of the virus, compared to only 9 percent of Democrats. In the fourth wave of the survey (w/c April 27), 57 percent of Republicans said the crisis was worse than they had expected (compared to 82 percent of Democrats). Respondents who lost income as a result of the crisis were significantly more likely to report that COVID-19 has been worse than anticipated (62 percent compared to about 48 percent who didn’t lose income within Republicans; and 84 percent compared to 75 percent who didn’t lose income within Democrats).
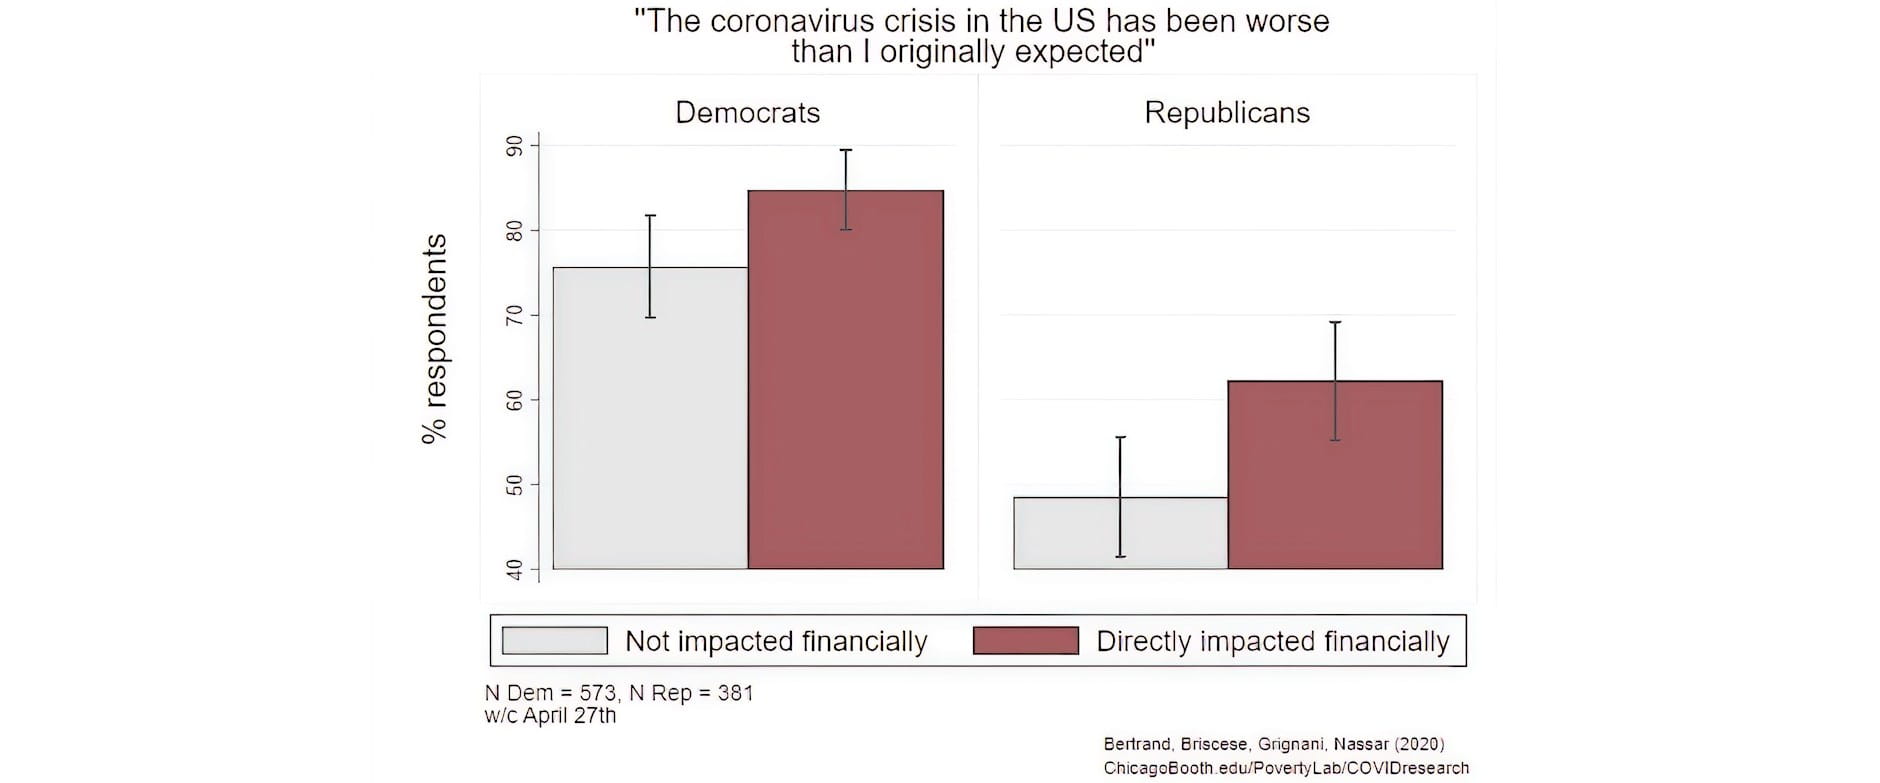
Confirming what we found in the second wave of the survey, the media plays an important role in shaping Americans’ views about the crisis. Among Republicans, those who watch Fox News were significantly less likely to report that COVID-19 was worse than they expected (44 percent compared to about 56 percent of Republicans who don’t watch Fox News), despite the same likelihood of being personally impacted by COVID-19. Similarly, among Republicans, those who don’t support Trump were 50 percent more likely to report that the crisis was worse than expected compared to those who report that they plan to vote for Trump.
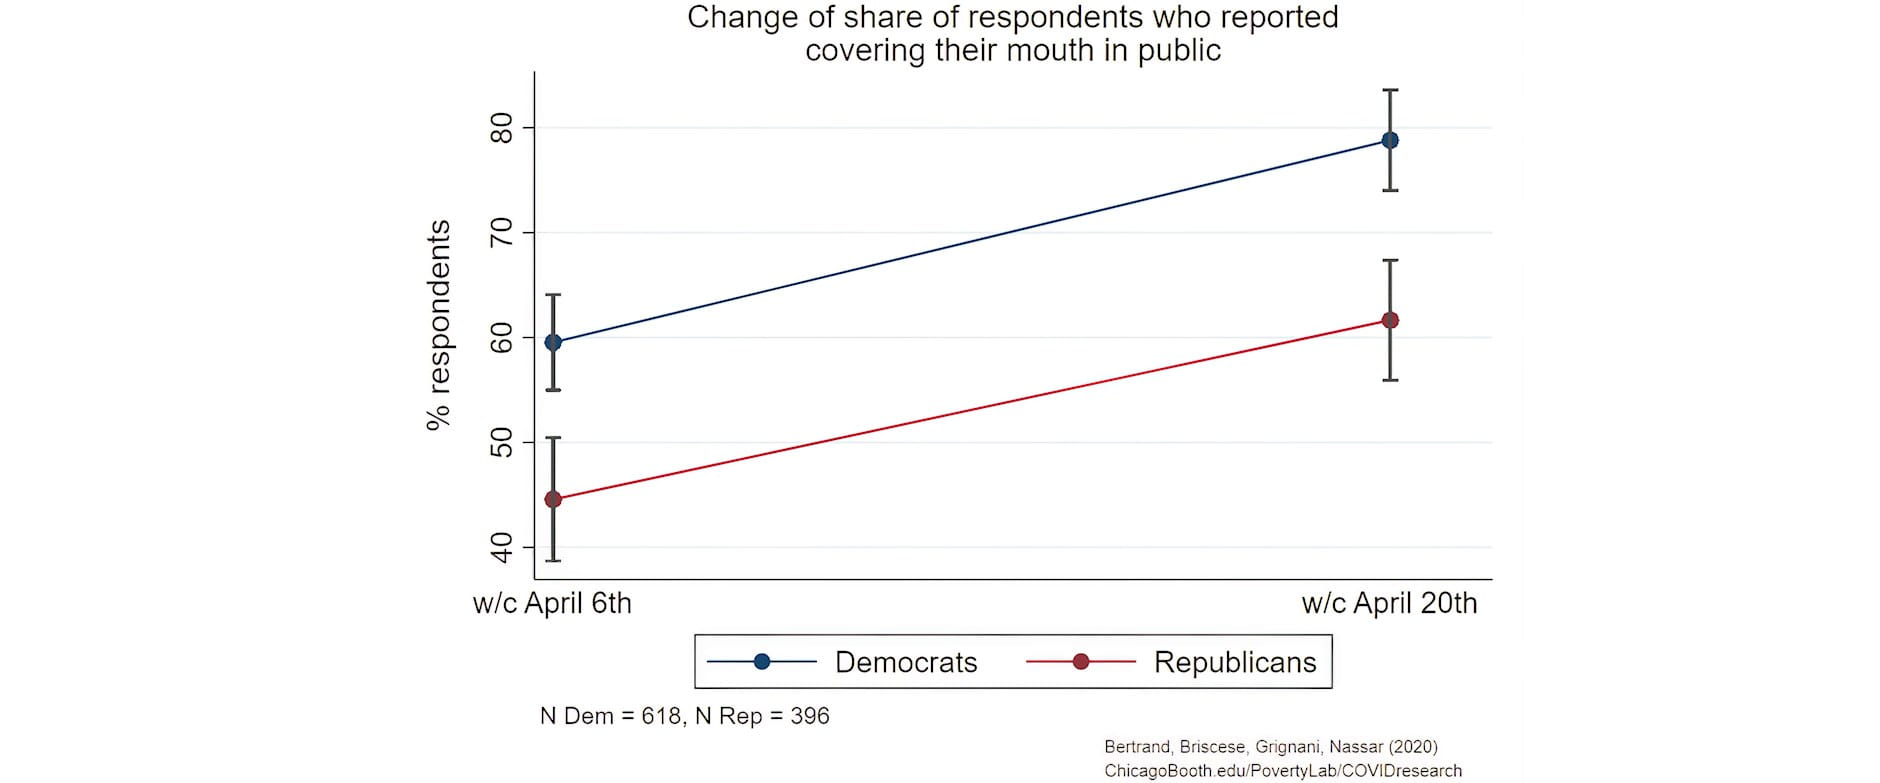
The share of Americans reporting covering their mouths in public has increased among both Democrats and Republicans, but the willingness to make this policy mandatory remains a divisive issue.
In early April, about 59 percent of Democrats reported covering their mouths in public to prevent contagion, compared to about 44 percent of Republicans. With time, the share of both types of voters who reported covering their mouths in public increased substantially, even if the party differences persist: by the end of April, almost 80 percent of Democrats reported covering their mouths in public compared to 63 percent of Republicans.
Despite this increase in compliant behaviors over time, we find a striking partisan difference in support for mandatory mask wearing: in mid-May, about 84 percent of Democrats backed mandatory mask wearing compared to about 47 percent of Republicans. The share of those who support mandatory mask wearing in mid-May is even lower among Trump supporters, where only about 39 percent back such a policy. Regardless of political affiliation, some factors increase support for mandatory mask wearing: being older, belonging to a racial minority, or knowing someone with pre-conditions. However, personal experiences—such as having lost income or knowing someone who contracted COVID-19—seem to have no impact on this issue.
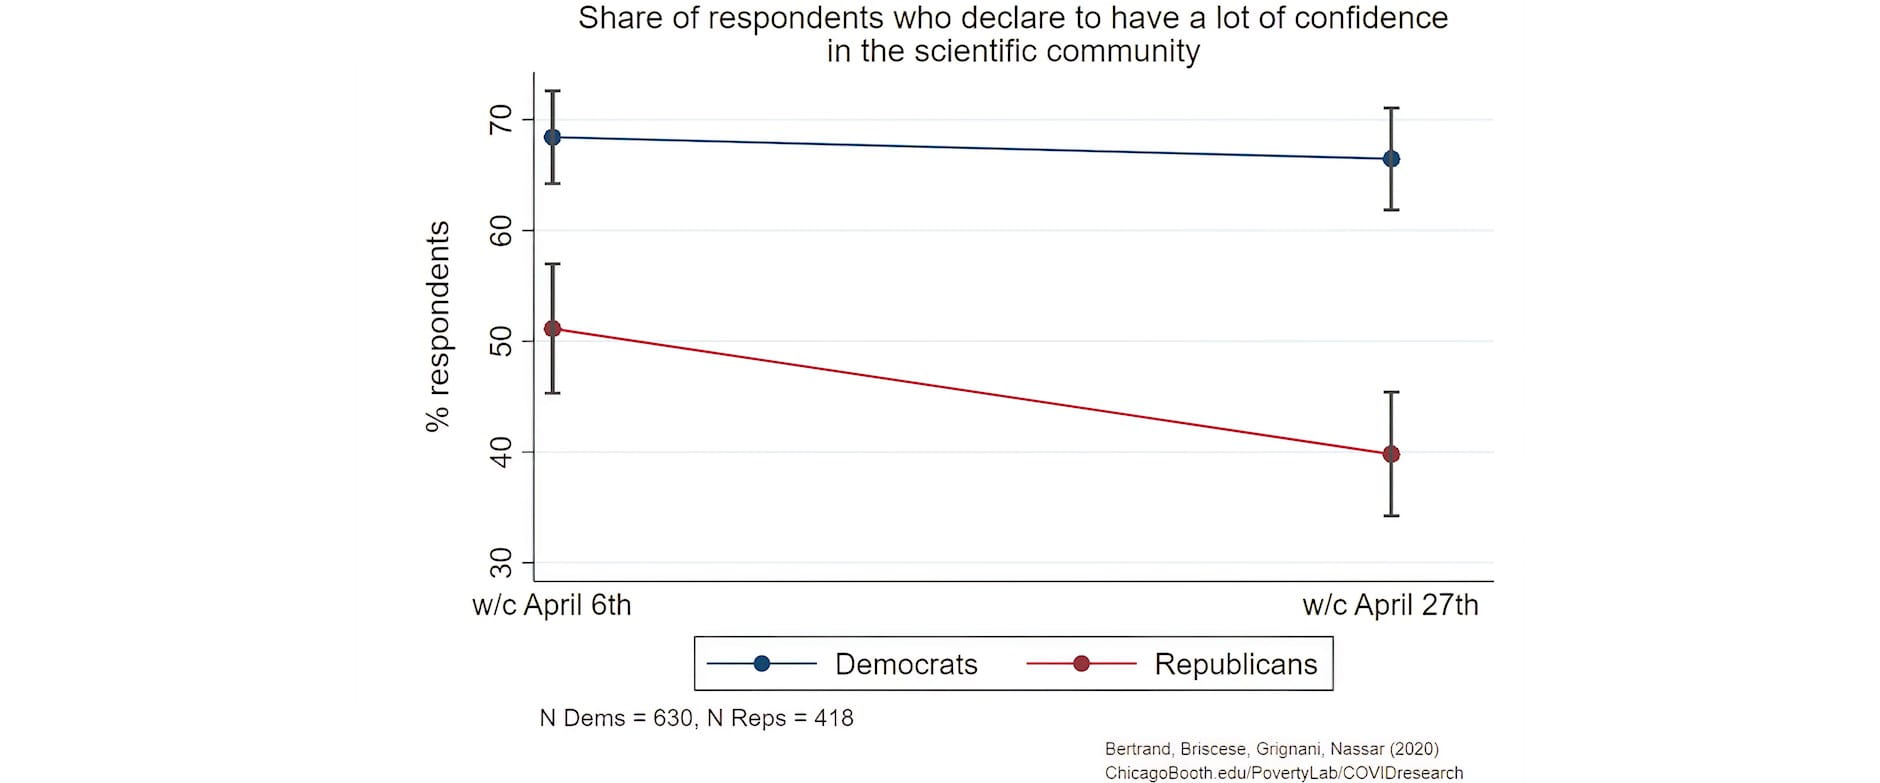
An important factor influencing support for mask wearing is trust in the scientific community. This has decreased significantly among Republicans since the start of the pandemic.
The pandemic is already affecting Americans’ support for institutions. Just over a period of one month, between the beginning and end of April 2020 (i.e. the first and the fourth wave of our survey), we record that the share of Democrats who have confidence in the scientific community has not changed (70 percent in the first wave and 68 percent in wave four), while that of Republicans fell significantly (from 51 percent to 38 percent). This is driven by those who lost income due to the crisis as well as by Republicans who believe that the crisis is worse than expected.
Support for other preventive measures, such as a tracking app, also depends on voting intentions.
In our second wave (April 13-18), we found strong differences in willingness to install a tracking app to reduce the spread of the virus along party lines, with 46 percent of Democrats in favor compared to 25 percent of Republicans. In the fifth wave of our survey (w/c May 18), we asked respondents whether they had changed their minds on installing the app, and found that Democrats marginally but significantly increased their willingness to install such an app (from 46 percent to 49 percent) while Republicans remained mostly against it (around 25 percent would install such an app). This difference is even larger when considering voting intentions during the November presidential election: while Biden voters significantly increased their willingness to install a tracking app (from about 48 percent to 54 percent over the same period), Trump voters significantly decreased their willingness over the same period (from 26 percent in wave two to 21 percent in wave five).
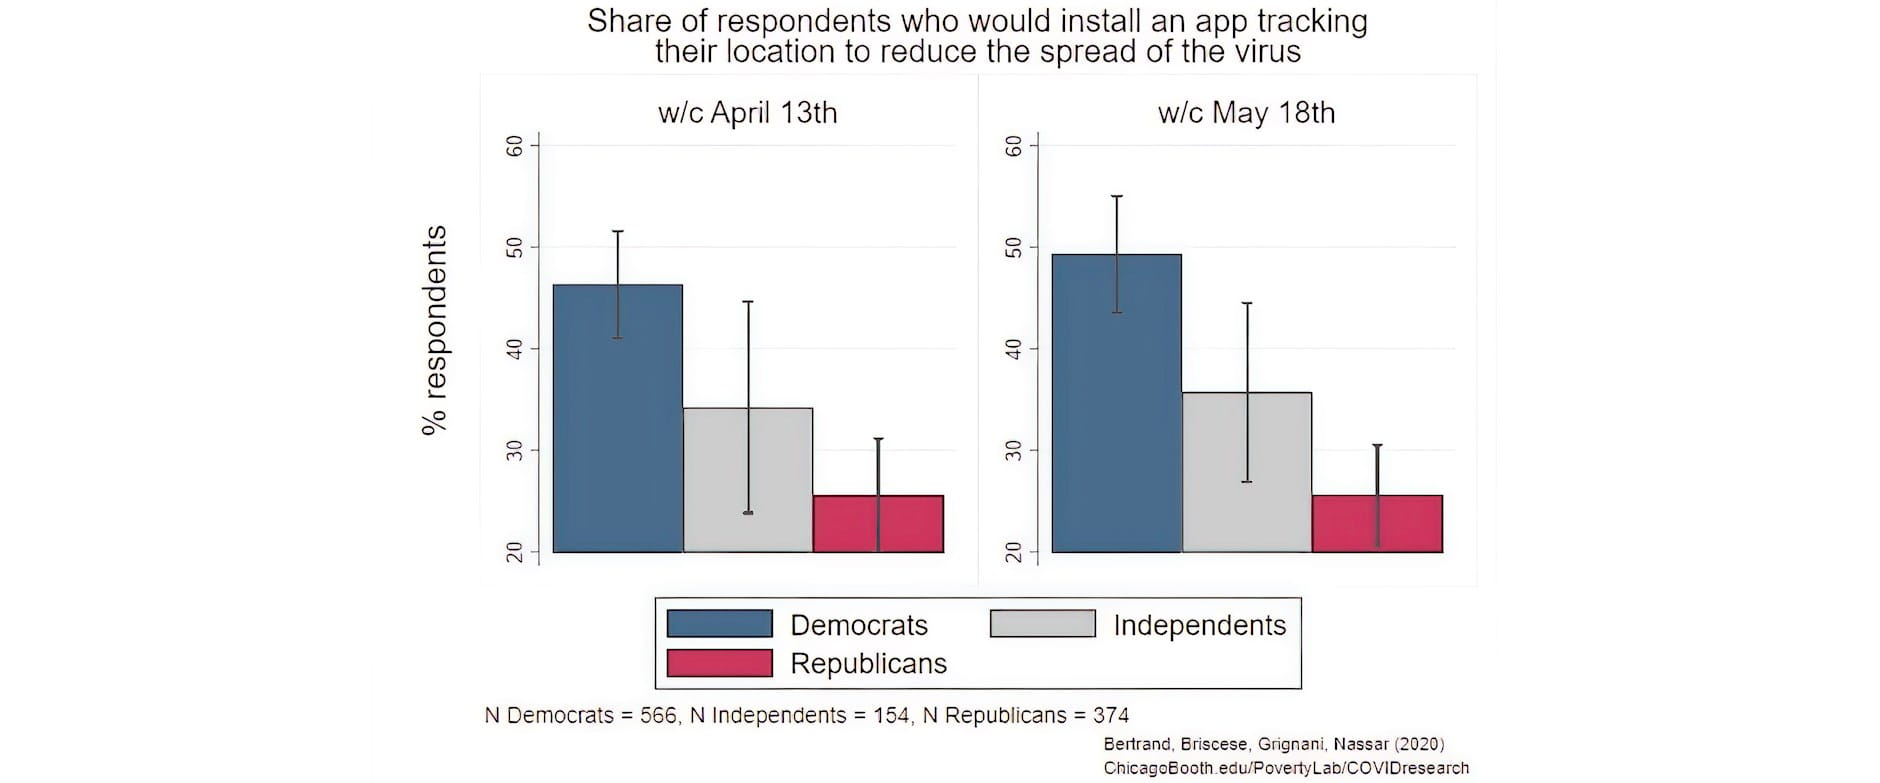
Notably, knowing a person who has been hospitalized with COVID-19 or having lost income due to the crisis does not increase support for the app, further backing evidence that support for solutions to address the pandemic remain mostly driven by politics rather than personal experiences.
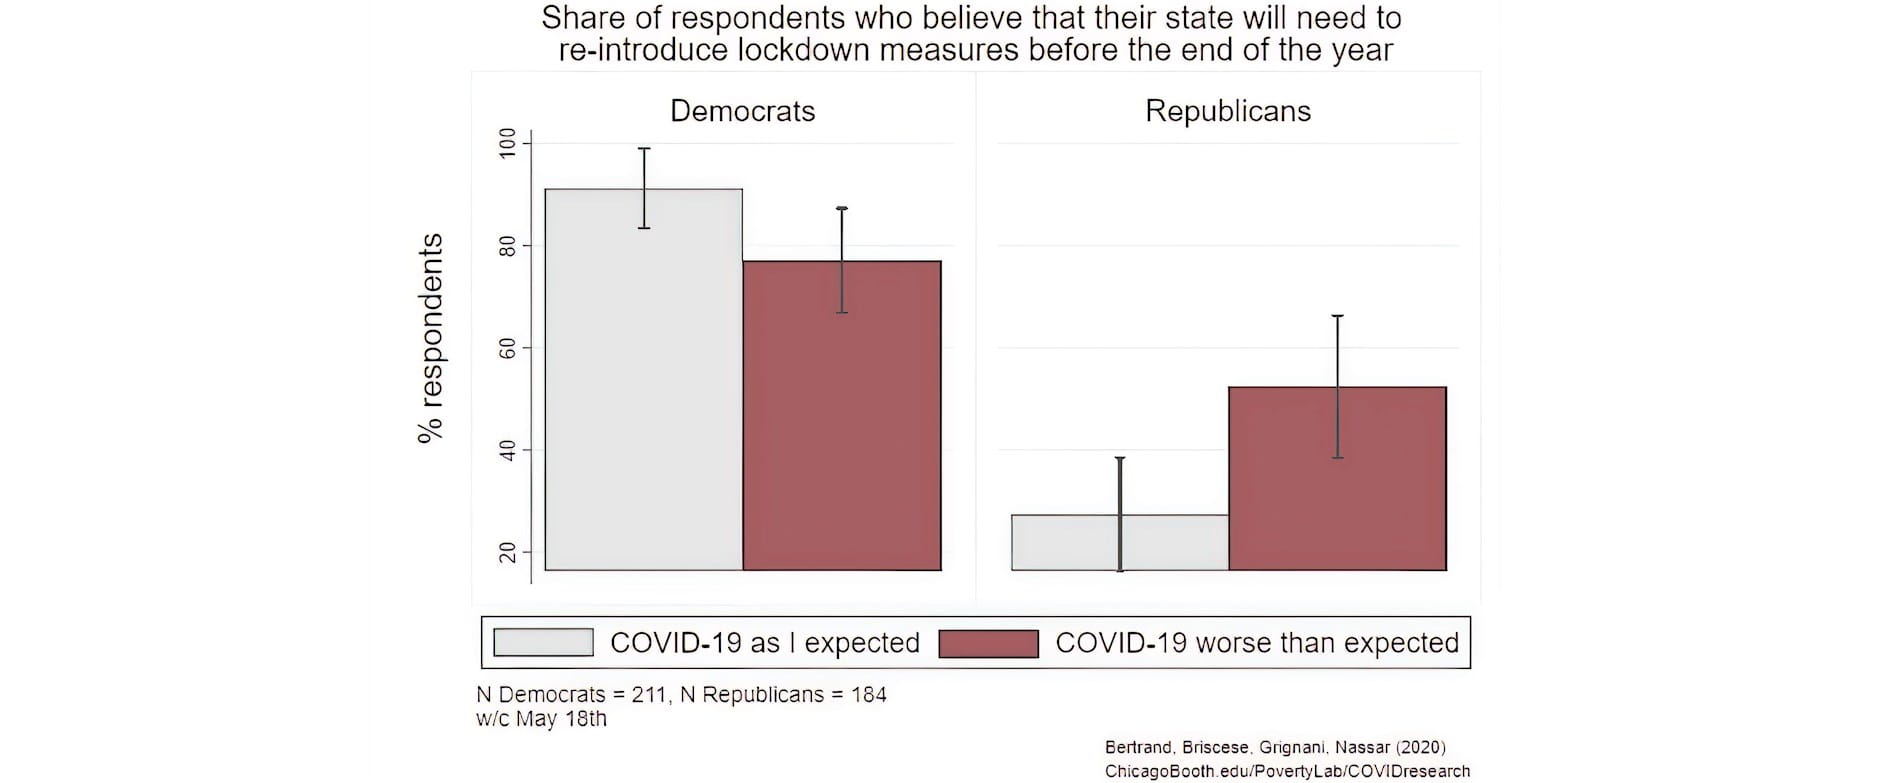
Political views and perception of the gravity of the crisis also influenced the likelihood of anticipating a second lockdown.
Looking back at survey responses from end of April, about 30 percent of Republicans said that the government should fully reopen the economy in May, whereas only about 5 percent of the Democrats agreed, underlining, again, a strong political divide. As states have reopened, COVID-19 infection rates are rising in the U.S., and some states are already reintroducing lockdown measures. In mid-May, 398 respondents identifying as Democrats or Republicans reported living in a state that had re-opened. We asked them “How likely do you think it is that your state will need to re-introduce lockdown measures for a second time before the end of the year?” We find a similar political pattern: about 43 percent of Republicans said that a second lockdown was likely, compared to a significantly higher percentage, 76 percent, of Democrats. However, personal experiences seem to affect such beliefs. Republicans who thought COVID-19 was worse than expected are twice as likely to anticipate a second lockdown as Republicans who did not think that COVID-19 was worse than expected, as shown in the graph below. This distinction is not present among the Democrats.
The past four months have illustrated how Americans view politics, their behavior, and their support for government policies. The next four months, leading up to the presidential election, will likely continue to shape this trend.
The unpredictable nature of the virus does not allow for reliable predictions about what the next months have in store for the U.S. Our research is showing how dramatic events, even if occurring over a short period, can either change or reinforce people’s views and preferences. Keeping a pulse on how the following months evolve will be important to understand how Americans feel leading up to the upcoming presidential elections. Our longitudinal survey, which we plan to resume in October, can help keep track of such changes, and what factors will influence them.
Check back to Rustandy's Coronavirus Social Impact Research page for the latest results. Read the press announcement.
Authors
Marianne Bertrand, Chris P. Dialynas Distinguished Service Professor of Economics, University of Chicago Booth School of Business, and Faculty Director, Chicago Booth's Rustandy Center for Social Sector Innovation and UChicago’s Poverty Lab; Guglielmo Briscese, Postdoctoral Fellow, Poverty Lab; Maddalena Grignani, Research Professional, Rustandy Center; and Salma Nassar, Director of Research Initiatives, Rustandy Center

![]()
![]()