Coronavirus Updates

Background

Following a one-day curfew popularly known as the “Janta Curfew” on 22 March 2020, the Government of India ordered a 21-day national lockdown to fight the spread of COVID-19 on 24 March 2020.  The lockdown was then extended three times and finally expired on May 31. During this time, most of India’s 1.3 billion residents were required to stop working and shelter indoors, with only a few exceptions. Starting on June 1, and with the exception of containment zones, lockdown restrictions have been relaxed in a phased manner with a focus on easing constraints on economic activity. Some early indicators have pointed towards a V-shape recovery after the lifting of the lockdown.

We document the evolution of unemployment, employment, income and consumption during and after the lockdown. After dramatic setbacks in April and May, all of these time series show rapid improvement immediately after the announcement that lockdown measures would be relaxed. However, they have not all returned to their pre-lockdown levels. There are signs of continued duress for many households, which may foreshadow a slower path to a full recovery.

Data

We analyze data from the Centre for Monitoring Indian Economy (CMIE)’s Consumer Pyramids Household Survey (CPHS). [1] CPHS is a panel survey that surveys approximately 175,000 households across India every four months. CPHS continued to run through the lockdown with roughly 45 percent of its usual sample, and returned to “normal” survey operations by mid-August. Despite the disruption to surveying imposed by COVID-19 and the lockdown measures, the data collected has remained representative throughout the period. [2]

The Current State of Recovery

While India recorded a sharp and large drop in GDP during the lockdown — gross domestic product shrank nearly 24 percent in the second quarter of 2020 compared to the second quarter of 2019 [3] — some early indicators have suggested signs of a V-shape recovery. In particular, several commenters have highlighted the year-on-year increase in GST [4] and gross income tax collections revenues. [5] Indian stock markets indexes such as the Nifty50 are higher than they were a year ago. [6] Others have pointed to a very strong kharif season. [7] Industrial activity has also picked up; port traffic, railway freight traffic, and electricity generation have all improved substantially. [8] Core industrial output has almost completely recovered from a 37.9 percent drop in April 2020. [9]

Also, and as seen in Figure 1, the unemployment rate, after skyrocketing to nearly 25 percent in April, had largely returned to its pre-lockdown level by June and was fully back to its February level by July, about 7 percent. [10]

 FIGURE 1

Bar graph showing monthly unemployment data

Yet other sources point to only a partial and incomplete convalescence. For example, most fast frequency indicators with the exception of electricity generation, railway freight traffic and e-way bills fell year-on-year in the September 2020 quarter. [3] After consistent month-on-month increases in the Index of Industrial Production (IIP) since May, this trend reversed in August. [7] The demand for petroleum products has continued to stay far below its 2019 levels. [11] Despite GST collections having grown, net tax collections are still down 14 percent compared to a year ago and the central government’s non-tax revenues are down 60 percent year-on-year. [5] 

Furthermore, the indicators suggesting a V-shape recovery cannot provide a perfect picture of the ongoing experiences of Indian households. For example, the GST taxes luxury goods more heavily and basic food consumption items (such as flour, fresh fruits, vegetables, meat, fish and milk) are not generally subject to the consumption tax, making GST revenue data a poor proxy of the well-being of the typical Indian household. Also, the unemployment rate calculates employment as a share of the labor force. As such, this statistic may mask discouragement effects, with workers exiting the labor force if they cannot find work. It may also mask exit of the labor force because of health safety concerns. Furthermore, even if most Indians have been able and willing to return to work post-lockdown, available labor market opportunities may have worsened, translating into lower incomes and negative pressures on consumption.

Key Finding #1: The employment to population ratio has not yet returned to its pre-lockdown levels.

Unlike the unemployment rate, the employment to population ratio (which isn’t limited to individuals who report being in the labor force) has not yet fully returned to its pre-lockdown level, as seen in Figure 2. [12] After a collapse in April and May, the employment to population ratio among those 15 years of age or older has hovered around 37 to 38 percent between June and October, from a base of closer to 40 percent pre-lockdown. [13]

Furthermore, when we exclude from the numerator individuals who report being employed but simultaneously report working zero hours (which we can measure until August), the decline in the employment to population ratio becomes larger, corresponding to about a 4 percentage point drop, or nearly 10 percent drop, relative to the pre-lockdown period, with no sign of improvement between July and August.

 FIGURE 2

Bar graph showing regular monthly income

Key Finding #2: Per-capita income levels remained depressed in June.

Even a full return to pre-lockdown employment rate levels (which clearly did not happen) could hide sharp differences in the nature of labor market opportunities and other income generating activities after the lockdown measures have been lifted. Individuals may earn less in the same occupation or may have shifted to less remunerative work. Indeed, others have documented a substantial shift from formal to informal employment as a consequence of the lockdown. [14] 

Figure 3 presents the monthly time series of household per capita income, including disaggregation by source of income, through June (the latest month of data availability). [15] Total income per capita was about 44 percent lower in April 2020 and 39 percent lower in May 2020 compared to the same months in 2019. Despite an uptick when the lockdown eased, per capita total income in June 2020 remained about 25 percent lower than in June 2019. However, this figure may overstate the decline due to lockdown and associated COVID-related disruptions as both total income and labor income were already trending down in the last quarter of 2019 and early months of 2020. This is consistent with a broad downward trend in the economy in early 2020 even before the pandemic and lockdowns. [16] When benchmarked to February 2020, June total (labor) incomes are only 17 (18) percent down. 

 FIGURE 3

Line graph showing sources of income

The drop in total income during the lockdown was primarily driven by a sharp drop in labor income, but was supplemented by a decline in business profits.  Interestingly, unlike labor income, business income does not show any sign of recovery by June. Rather, business profits remain 24 percent below their level in February 2020 and 31 percent below their level in June 2019. 

While government assistance via direct benefit transfers increased during the lockdown, these in-cash transfers represent such a small proportion of total income that they played virtually no role in stabilizing income for the average Indian household during the lockdown.  This does not rule out that other forms of government support, such as wage income via the Mahatma Gandhi National Rural Employment Guarantee (MGNREGA) workfare scheme (which are captured in the wages time series in Figure 3), or in-kind transfers via the Public Distribution System (PDS) (which are not captured in any of the time series in Figure 3), may have helped many households during the lockdown, and continue to stabilize these households post-lockdown.

Key Finding #3: Very few occupations have been spared from the negative income shock.

Drops in wage income appear to be widespread across occupations. [17] Figure 4 presents the percent changes in median wages by occupation both during (May, line in red and scatter in circles) and after (June, line in blue and scatter in triangles) the lockdown period. [18] In particular, we relate median wage income among those employed full-time in an occupation pre-COVID (September to December 2019; x-axis) to percent changes in that median income in that occupation, again among those employed full-time, both during (May 2020) and after the lockdown (June 2020).

As can be seen below, the vast majority of occupations experienced very large declines in income for the median individual in that occupation during the lockdown. While some substantial recovery had occurred by June, median incomes remained below baseline in about 80 percent of occupations in that month. Considering the 10 largest occupations in terms of employment numbers in June, the largest losses in median income in that month compared to baseline are recorded among subsistence farmers, smaller businessmen (such as shopkeepers or dhaba owners), agricultural laborers, and industrial and machine workers.  Regression analyses show that income losses during the lockdown were both economically and statistically larger among lower income occupations, while no such statistical relationship can be detected post-lockdown.

 FIGURE 4

Line graph showing percent difference in monthly income

Overall, Figures 2 to 4 highlight that the recovery in the unemployment rate does not fully reflect the ongoing economic situation in India’s labor market. Rather, substantial reductions in employment, and income among the employed, remained post-lockdown.

Key Finding #4: Changes in per-capita household income during and post-lockdown are similar across the income distribution, except for the top of that distribution.

Figure 5 assesses how the combination of employment losses, drops in wage income among those employed, and changes in non-labor income impacted per-capita household income by income groups both during and after the lockdown. [19] We report the percent change in household income per capita relative to January 2020 across five income groups. The lowest 3 income groups, which account for about 70 percent of the population, follow a similar pattern. If anything, households towards the middle of the income distribution (second and third income groups in Figure 5) experienced somewhat larger losses during the early part of lockdown than the poorest households, but this difference was muted by May. The slowest recovery appears concentrated among higher income households, and especially those in the highest income group. However, it is important to note that per capita income was already trending down prior to the lockdown for that highest income group, suggesting that other economic forces could be at play. 

 FIGURE 5

Graph showing income over course of several months in lockdown

Key Finding #5: There is a lot of variation across Indian states in the extent of the economic downturn.

Figure 6 reports on the variation among states in the extent of the income decline. For each state, we compute year-on-year percent drop in per capita income for April 2020 as well as for June 2020. [20]

Figure 6 shows that Chhattisgarh, Puducherry, Delhi and Tamil Nadu experienced the greatest income losses during the lockdown, with income per capita dropping by 77 percent, 71 percent, 66 percent, and 65 percent percent, respectively, in April 2020 relative to April 2019. After the lifting of the lockdown measures, the greatest income losses were concentrated in Chhattisgarh, Delhi, and Haryana, with income per capita in those states 55 percent, 46 percent, and 46 percent percent below what they were a year before, respectively. A few states however had regained most, and sometimes all, of the lost ground immediately after the lockdown was lifted. In particular, income per capita in Karnataka, Chandigarh, Assam, and Meghalaya were at most 5 percent lower in June 2020 relative to June 2019.

 FIGURE 6

Map showing income drop according to state in India

Key Finding #6: Per-capita spending on basic food items remains sharply depressed through August.

While the income data does not currently extend beyond June, we can also assess how well people are faring using weekly expenditure data, which is available for a few high-frequency consumption categories through August (Figure 7). [21] A look at the expenditure data also allows us to demonstrate that the employment and income losses documented above are having real negative welfare consequences for Indian households. 

Per capita expenditures on milk, eggs, meat and fish, while steady throughout the 2 years preceding the lockdown, dropped by about 45 percent in April 2020 and had only recovered about half of this drop by July and August; in particular, expenditures on milk, eggs, meat and fish were 23 percent percent lower in August 2020 relative to August 2019. Per capita expenditures on other food items (which includes among other things fruits, vegetables, potatoes, and spices) dropped by about 20 percent during the lockdown and had barely recovered from that drop by August.  

 FIGURE 7

Graph showing expenses over course of months in COVID-19 lockdown

These results mirror those using monthly expenditure data, which covers a wider range of food and non-food expenditures, but is currently only available until June. As seen in Figure 8, these substantial declines in consumption extend to a much broader set of food and non-food expenditures. [22]

 FIGURE 8

Line graph showing monthly expenses by category

Summary

When the lockdown ended there were rapid improvements in unemployment, employment, income, and consumption. But, the recovery is not complete. Most of these economic indicators have still not reached their pre-lockdown levels, and whether and when they will do so remains unclear. Further, these figures make it clear that the comprehensive view granted by household level data provides important insights beyond those possible from more aggregated indicators. 

The Indian central government has recently announced a new stimulus package worth 15 percent of India’s GDP. [23] Critically, this includes schemes to incentivize job creation and to increase demand.  As new data become available, we will continue to document trends over time and assess whether these stimulus measures are helping accelerate the recovery in household incomes and expenses. We will also try to understand what drives the large geographic variation in the severity of the economic shock and the speed of recovery and investigate why some individuals and households take longer to recover from the lockdown than others. 

Check back to Rustandy's Coronavirus Social Impact Research page for the latest results. Read the press announcement.

Marianne Bertrand, Chris P. Dialynas Distinguished Service Professor of Economics, University of Chicago Booth School of Business, and Faculty Director, Chicago Booth's Rustandy Center for Social Sector Innovation and UChicago’s Poverty Lab; Rebecca Dizon-Ross, Associate Professor, University of Chicago Booth School of Business; Kaushik Krishnan, Chief Economist,  Centre for Monitoring Indian Economy (CMIE); and Heather Schofield, Assistant Professor, Perelman School of Medicine and The Wharton School at the University of Pennsylvania. Emails: marianne.bertrand@chicagobooth.edu; kkrishnan@cmie.com; hschof@wharton.upenn.edu

Acknowledgements

We thank Adarsh Kumar and Karthik Tadepalli for excellent research assistance.


[1] — CPHS is conducted across the country, except in Arunachal Pradesh, Nagaland, Manipur, Mizoram, Andaman & Nicobar Islands, Lakshadweep, Dadra & Nagar Haveli and Daman & Diu. Some parts of Jharkhand and Chhattisgarh are no longer surveyed due to concerns for CMIE staff safety. Ladakh is also not surveyed as it is not accessible year-round. Data from CPHS is available as a subscription service entitled Consumer Pyramids dx. The data for this piece was downloaded on November 12, 2020 from the CPdx website. CMIE could conduct slight revisions of the data, particularly for monthly income and expenditure data for May and June 2020.


[2] — CPHS execution during the lockdown of 2020, Mahesh Vyas (19 Aug 2020), How We Do It Series, Consumer Pyramids Household Survey, CMIE.


[3]October 2020 Review of Indian Economy: Macro-economic Performance, Manasi Swamy (14 Oct 2020).


[4]October GST collection tops Rs 1 lakh crore, 1st time since February, Times of India (Nov 2 2020).


[5]Government's revenues muted despite green shoots, Manasi Swamy (31 Oct 2020).


[6] —  November 2020 Review of Indian Economy: Financial Market Performance, Manasi Swamy (5 Nov 2020).


[7]October 2020 Review of Indian Economy: Sectoral Performance, Janaki Samant (21 Oct 2020).


[8]October 2020 Review of Indian Economy: Macro-economic Performance, Manasi Swamy (14 Oct 2020).


[9] Core industries' output nears year-ago level in September, Manasi Swamy (04 Nov 2020).


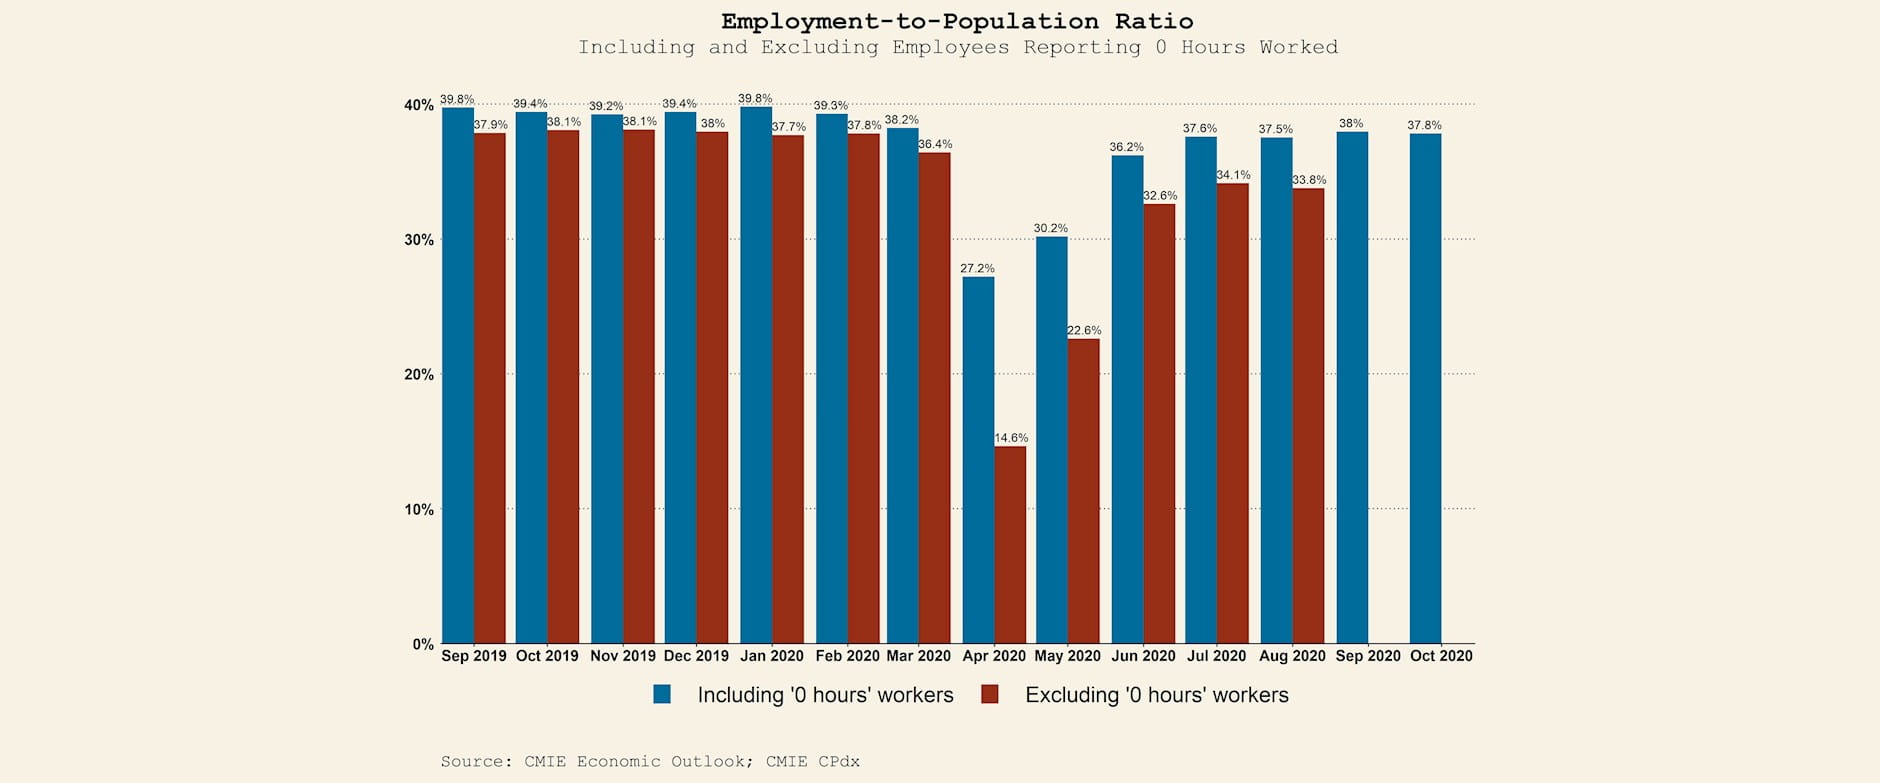
[10] — CMIE’s definitions for workforce statistics match those that are used broadly. Details of their methodology and definitions can be found here.


[11]Petroleum products demand struggles to recover, Manasi Swamy (19 Oct 2020).


[12] — The employment-to-population ratio is computed among those 15 years of age or older. Anyone engaged in any economic activity on either the day of the survey or the preceding day of the survey, or is generally regularly engaged in any such activity, is considered to be employed.  “Excluding '0 hours' workers” remove from the count of the employed individuals reporting zero hours of work on a representative day in the week period prior to being surveyed; this measure is only available until August 2020, the latest month of published CPHS data.


[13] — Others have also pointed to a collapse in the employment rate. See Employment falls in October (2 Nov 2020), Mahesh Vyas, CMIE; Labour markets weak in October, Mahesh Vyas (19 Oct 2020), Economic Outlook, CMIE; Labour force shrinks in September, Mahesh Vyas (2 Oct 2020), Economic Outlook, CMIE; Deceptive fall in the unemployment rate, Mahesh Vyas (21 Sep 2020), Economic Outlook, CMIE.


[14]South Asia Economic Focus, Fall 2020 : Beaten or Broken? Informality and COVID-19, World Bank; Job losses in white and blue collar workers, Mahesh Vyas (14 Sep 2020); Salaried job losses, Mahesh Vyas; An unhealthy recovery, Mahesh Vyas (10 Aug 2020).


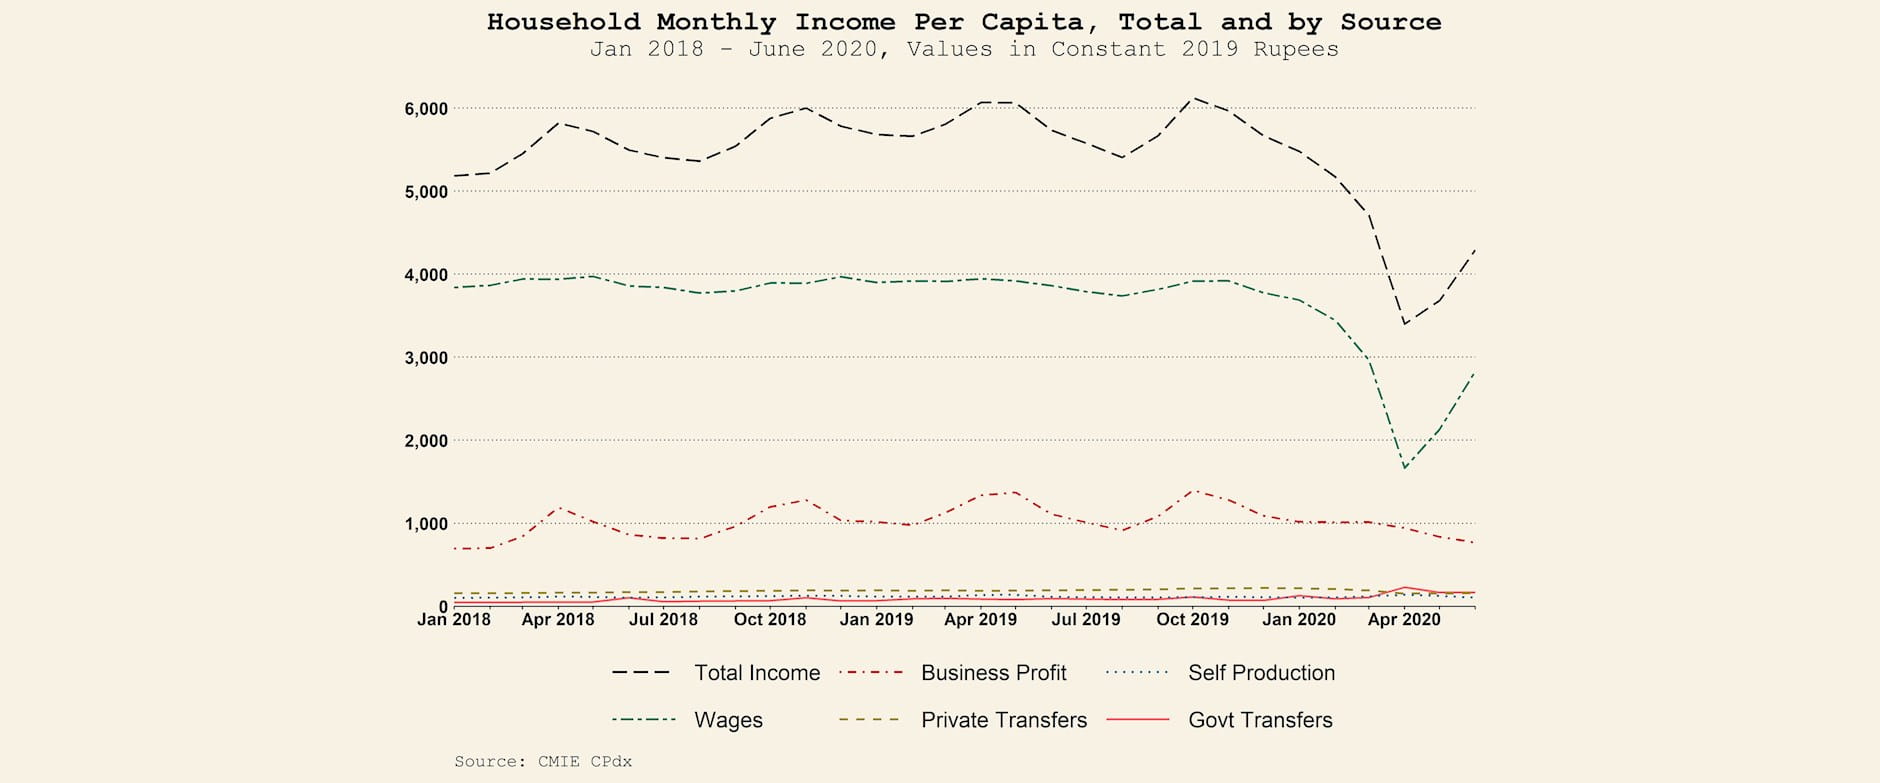
[15] — Per capita incomes are calculated by dividing the sum of household members' incomes by household size. Values are reported in inflation-adjusted constant 2019 Rupees using CPI data from the Ministry of Statistics and Program Implementation. Values are weighted using CMIE’s ‘country’ level weights to be nationally representative. 


[16]The R is deep, long and broad, Mahesh Vyas (19 Mar 2020), Economic Outlook, CMIE; It's a deeper recession, Mahesh Vyas (17 Mar 2020); The worst not yet over for Indian economy, Manasi Swamy (2 Mar 2020); Labour metrics flounder in February, Mahesh Vyas (2 Mar 2020); It's recession, Mahesh Vyas (24 Feb 2020); The Misery Index, Mahesh Vyas (17 Feb 2020); Where are the jobs?, Mahesh Vyas (28 Jan 2020); Indian economy in troubled waters, Manasi Swamy (3 Dec 2019).


[17] — CMIE records income earned from self-production and business profits at the household level. More often than not, such income cannot be attributed to an unambiguous person. Therefore, such data is collected at the household level, making it difficult to map these other sources of income into occupations.  However, if a businessman or a self-employed individual takes a salary from the business, it is recorded by CMIE as wage income. Wage income also include over-time payments, bribes, monetary value of in-kind goods, and rent reimbursed by the employer. 


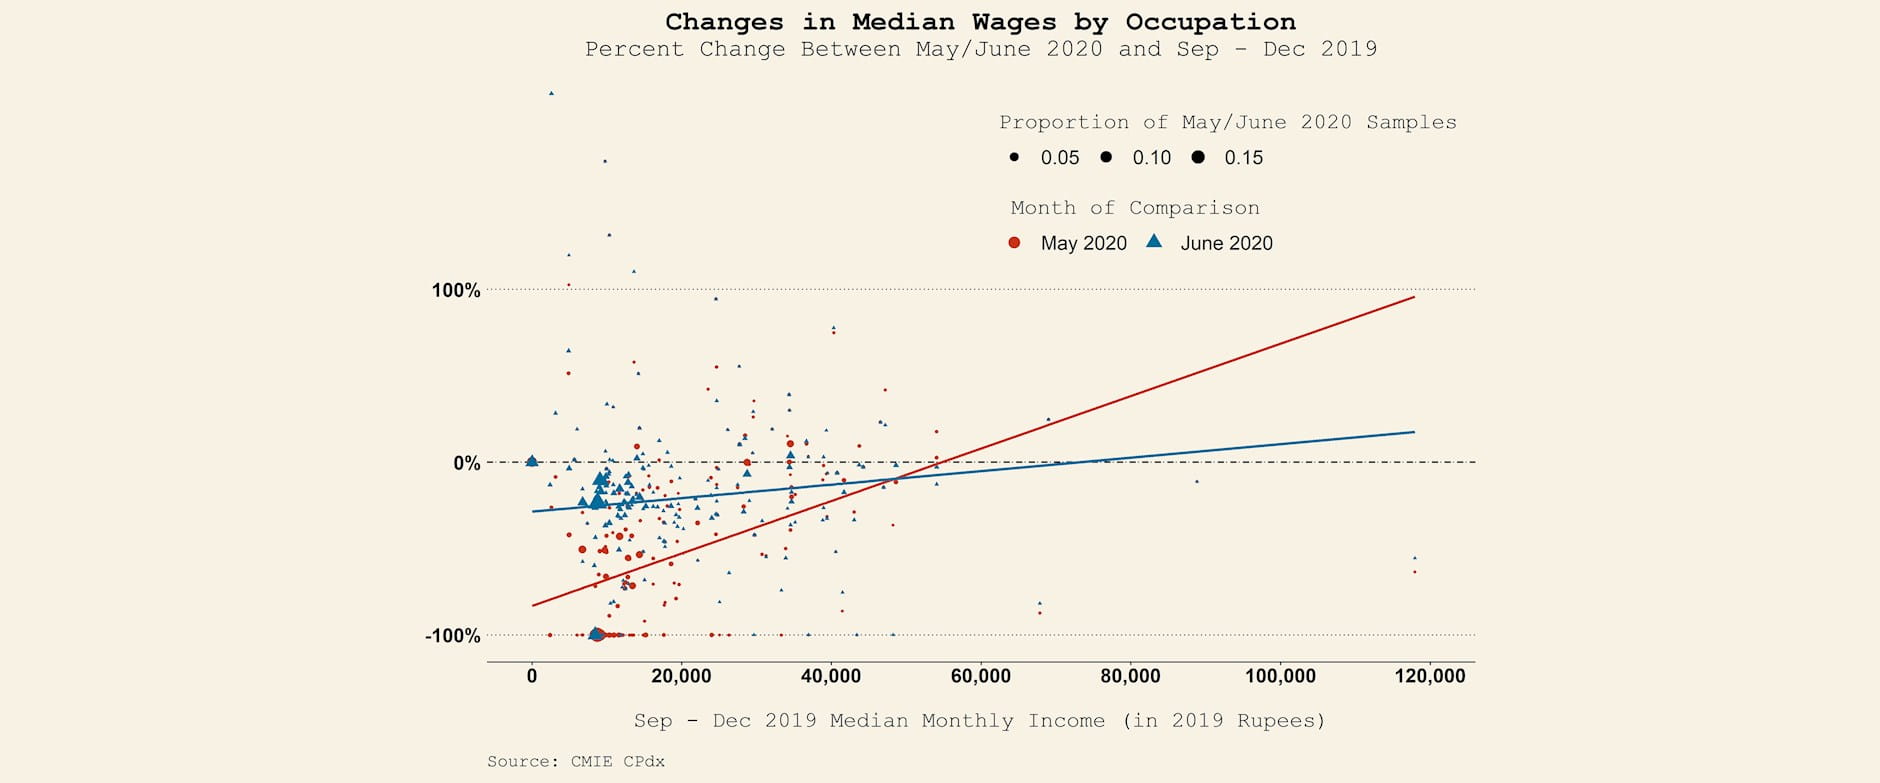
[18] — For the purposes of this chart, a member's occupation is assumed to be constant throughout a wave. Simple (unweighted) medians of wages for each occupation are taken for the period/months of interest. Size of the bubble corresponds to the unweighted proportion of the total sample employed in that occupation in May and June 2020 respectively. Only those occupations observed in the base period (Sep - Dec 2019) and the month of interest (May or June 2020) are included. Chart values reflect the percentage change in median wages in each occupation between the base period and month of interest. Occupations with Rs. 0 median wages in both waves are recorded to have a 0 percent change. Solid lines for May and June 2020 represent fitted values of the weighted regression run on percentage change in year-on-year income and Sep - Dec 2019 median monthly income; weights for the regression are the counts of the sample in an occupation in the respective month of interest. Values are reported in inflation-adjusted constant 2019 Rupees using CPI data from the Ministry of Statistics and Program Implementation.


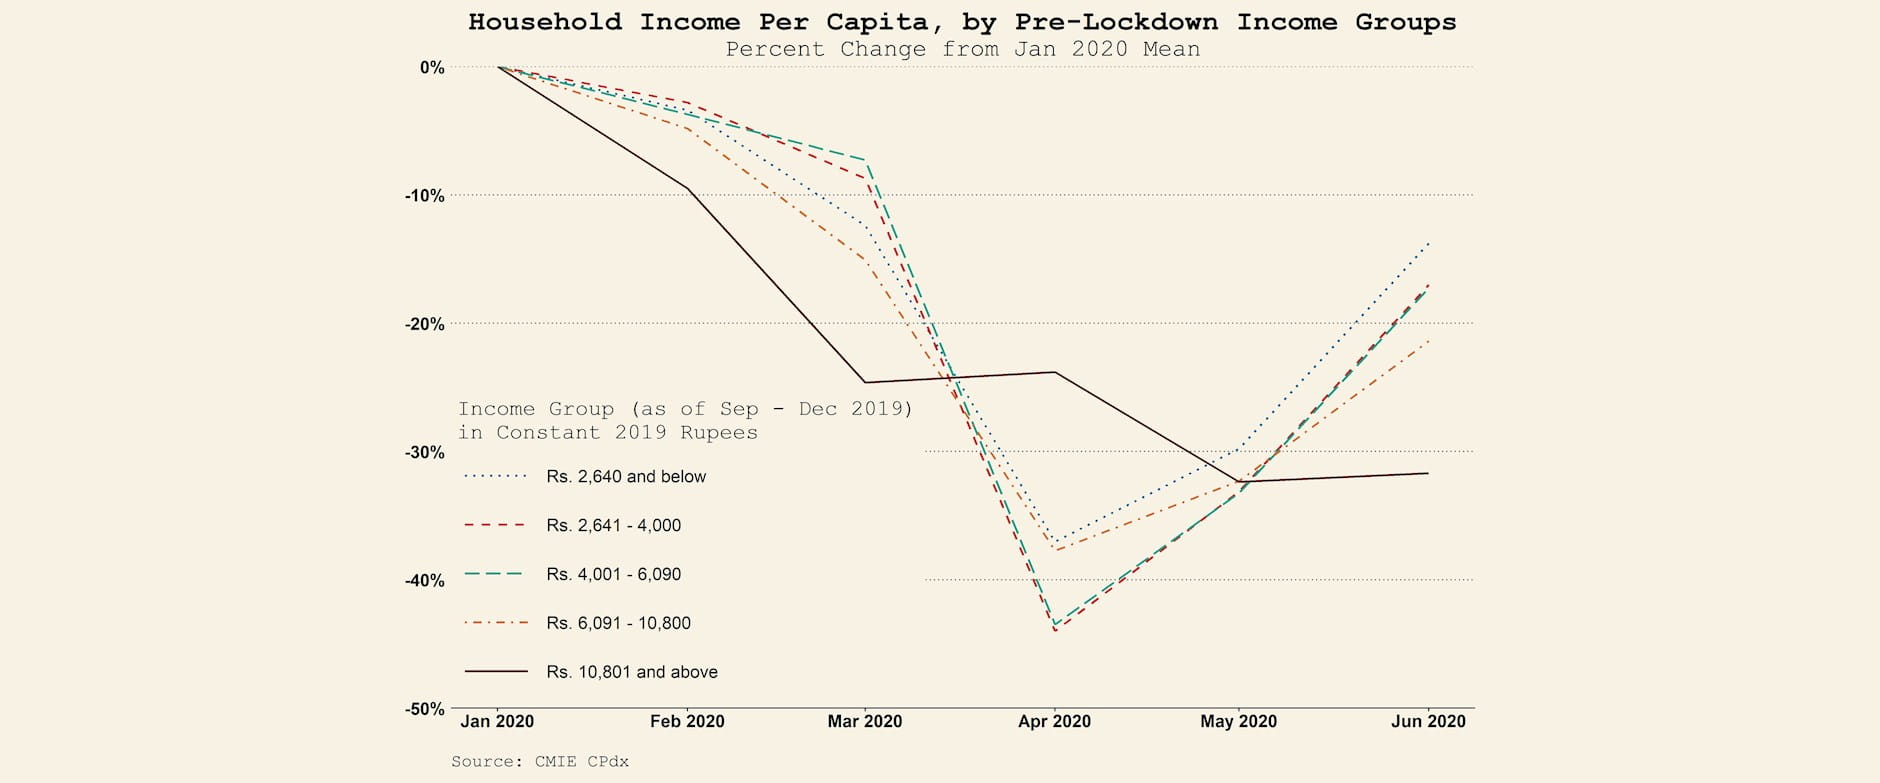
[19] — Sample is restricted to households in CMIE's September - December 2019 wave. Households that shifted residences have also been excluded. These restrictions require us to impose an additional adjustment factor to CMIE’s ‘country’ weights to account for the change in the sample. Our reweighting procedure causes the small town stratum in Udhampur district and the small and large towns strata in Anantnag district, both in Jammu and Kashmir to be dropped. Small towns are defined to be those with fewer than 20,000 households in Census 2011, and large towns are defined to contain 60,000-200,000 households in Census 2011. The five income groups are selected based on monthly income per capita in the September - December 2019 wave and they respectively account for, from lowest income group to highest, 20 percent, 25 percent, 25 percent, 20 percent, and 10 percent of the weighted sample in September 2019. We report changes in mean per capita income in each group relative to the group's mean income in January 2020. Per capita value is calculated by dividing household's total income by household size. Values are adjusted for inflation using CPI data from the Ministry of Statistics and Program Implementation.


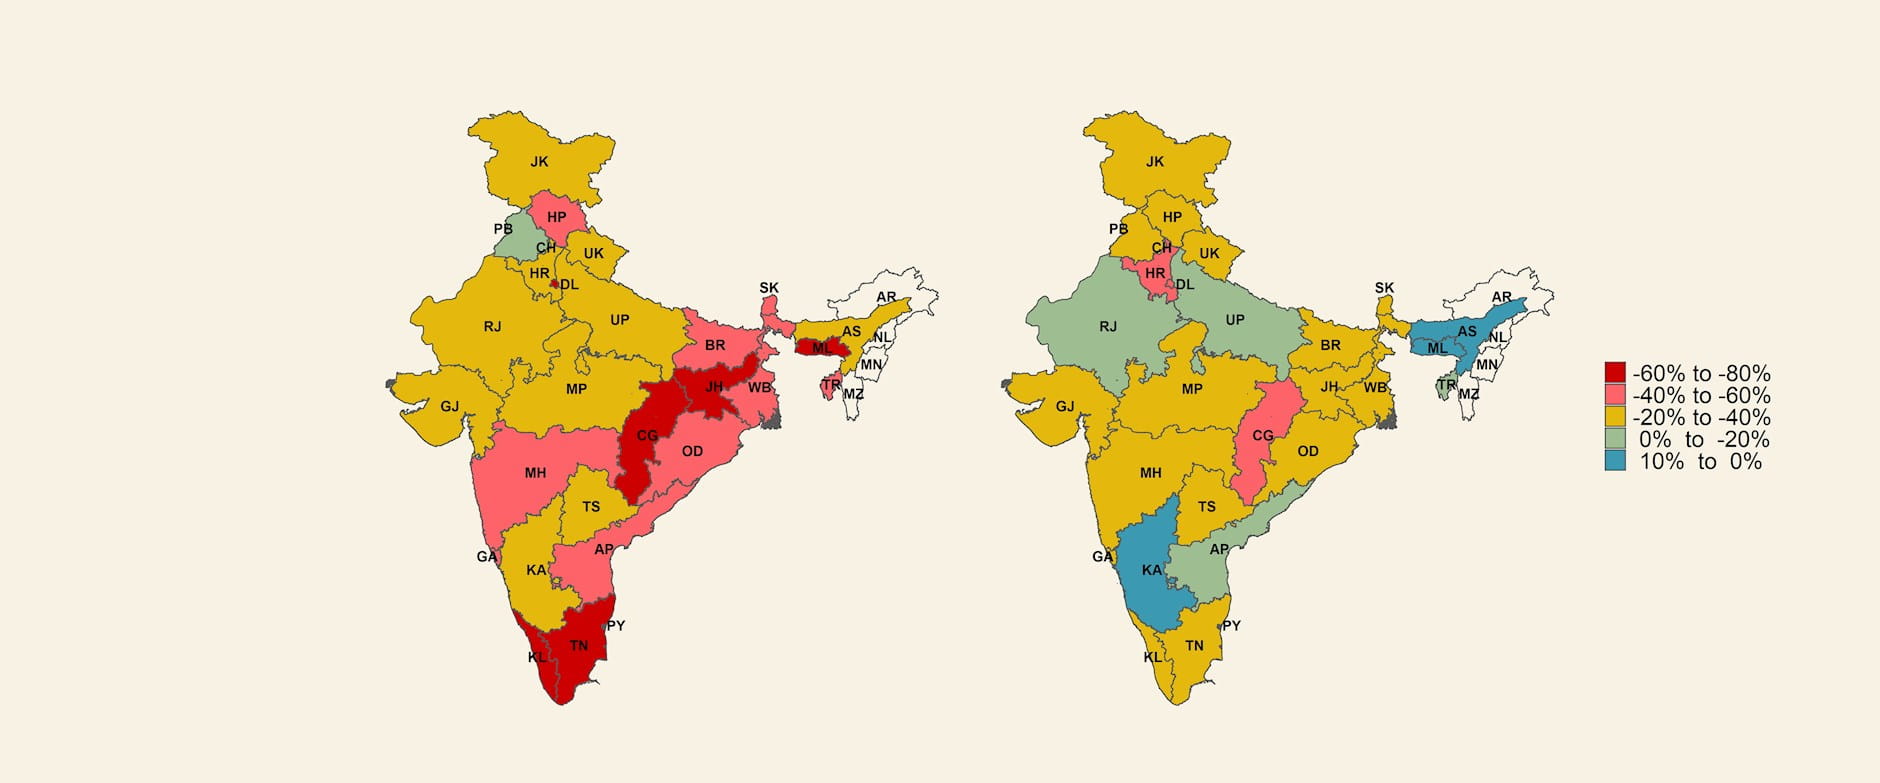
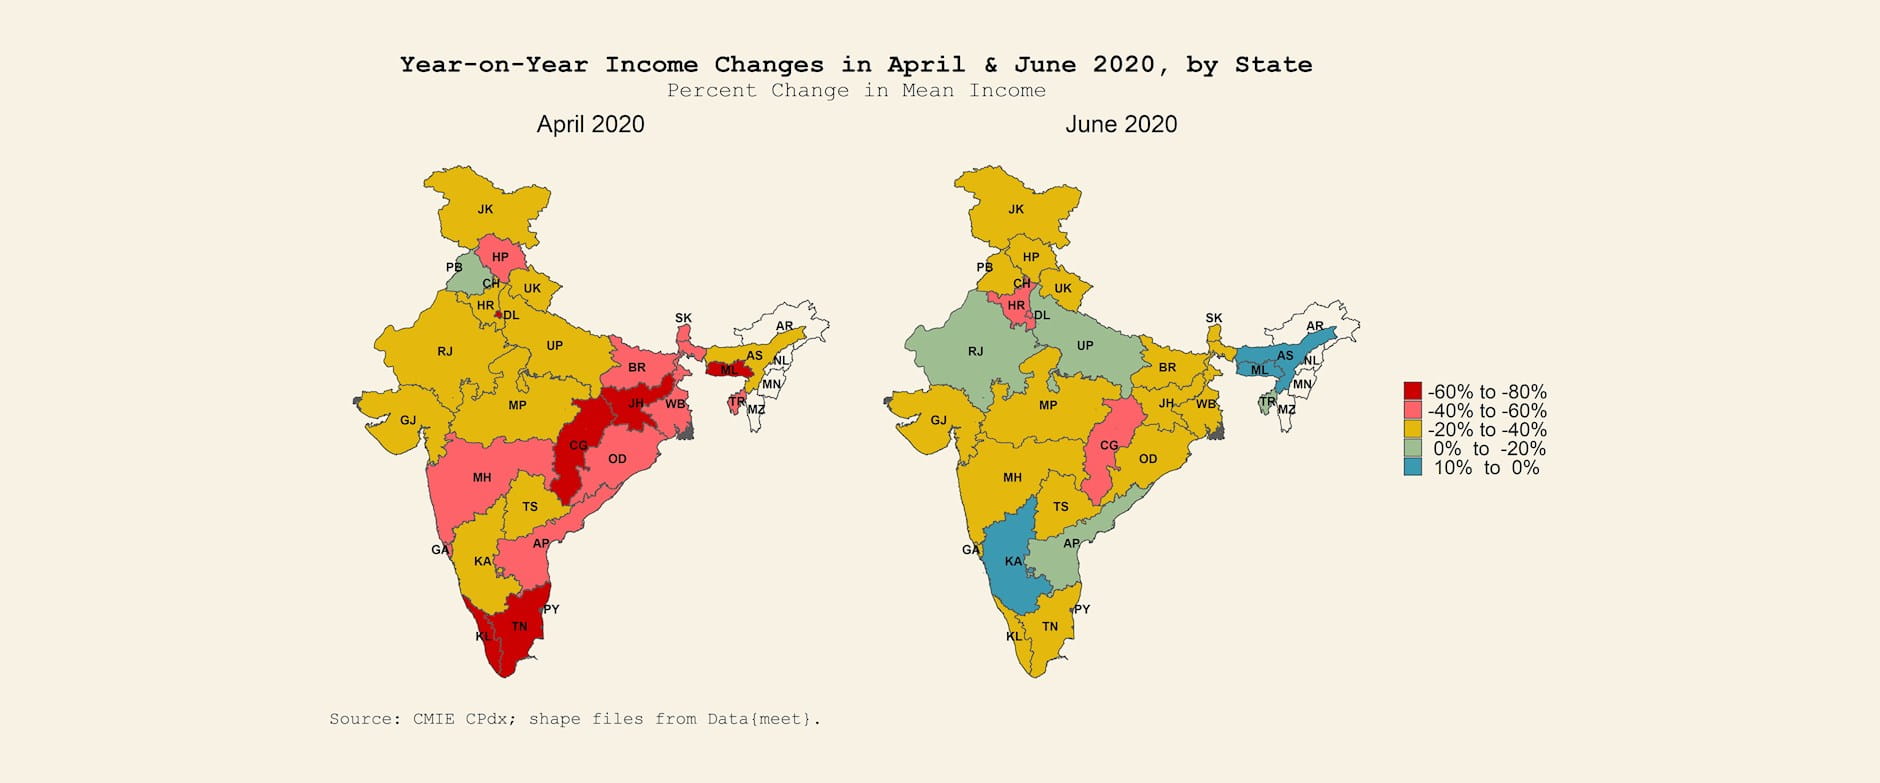
[20] — This figure uses shapefiles for India from Community Created Maps of India by Data{meet}. These shape files depict ISO countries and not sovereign states. We do not claim these to be maps that accurately depict India’s sovereign or internal political borders. Any queries or issues regarding these shape files should be directed to Data{meet}. Values are adjusted for inflation using CPI data from the Ministry of Statistics and Program Implementation. Values are weighted using CMIE’s provided ‘state’ level weights in order to appropriately represent mean values of each state. 


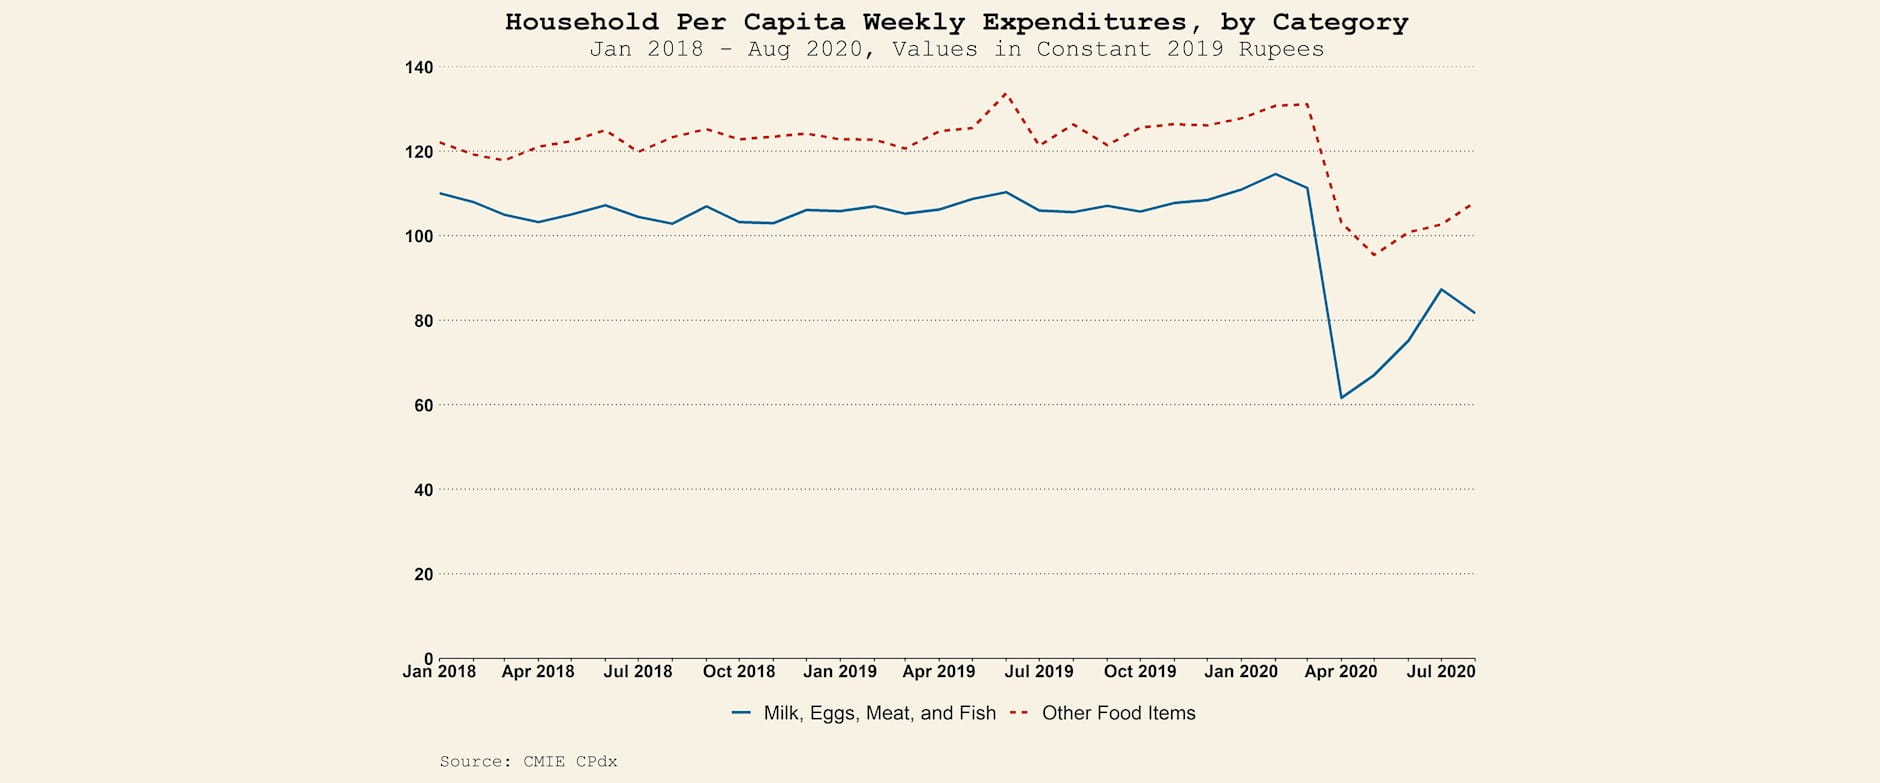
[21] — Per capita value is calculated by dividing household’s weekly expenditures by household size. Values are reported in inflation-adjusted constant 2019 Rupees using CPI data from the Ministry of Statistics and Program Implementation. In order to reflect month-on-month changes, an unweighted mean is taken for each month of survey execution. “Other Food Items” include vegetables and wet spices, including potatoes and onions, fruits, bread, biscuits, salty snacks, sweets, chocolates, cakes and ice cream.


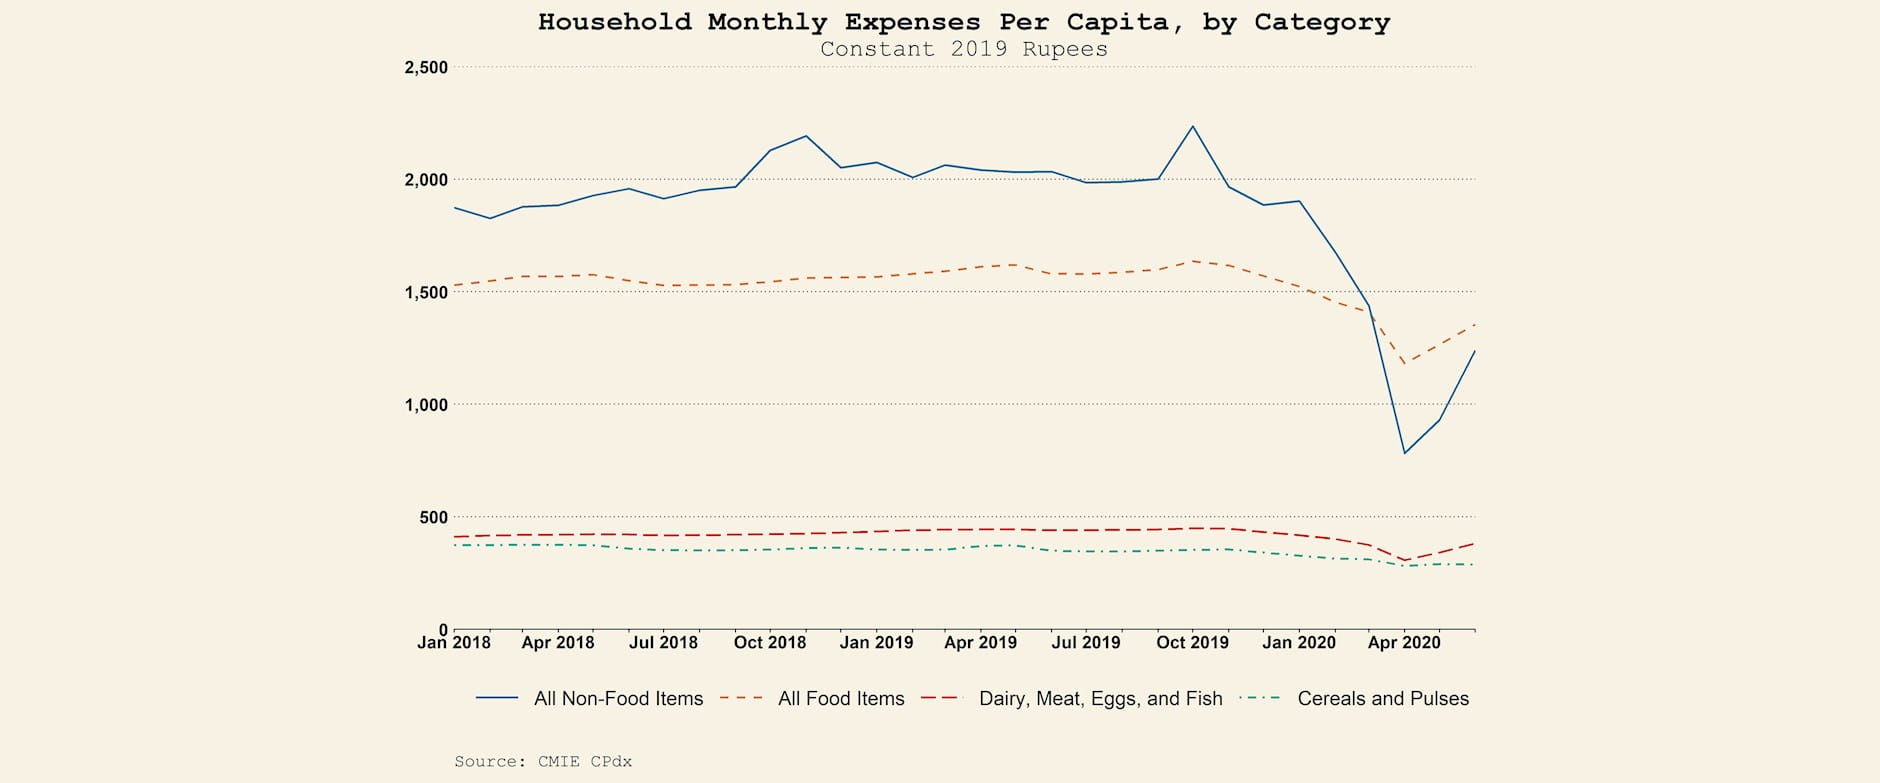
[22] — Per capita value is calculated by dividing household’s monthly expenditures by household size. Values are reported in inflation-adjusted constant 2019 Rupees using CPI data from the Ministry of Statistics and Program Implementation. All series, except “Cereals and Pulses,” use CMIE’s 'adjusted' monthly expenditure data. Values are weighted using CMIE’s provided ‘country’ level weights in order to be nationally representative.


[23]Atmanirbhar Bharat 3.0: Total stimulus package announced is of Rs 29.87 lakh core, 15 percent of GDP, says FM Sitharaman, Moneycontrol News.


UChicago Poverty LabRustandy Center logoCentre for Monitoring Indian Economy (CMIE) logoWharton University of Penn logoPerelman School of Medicine University of Pennsylvania logo

Related Story

Email icon

Get Updates from the Rustandy Center

Please send me updates on social impact events, programs, and research at Chicago Booth.

Get Updates from the Rustandy Center

Recommendations