

How are Indian Households Coping Under the COVID-19 Lockdown? Eight Key Findings
- By
- May 11, 2020
- Rustandy Center for Social Sector Innovation
Overview. COVID-19 was first detected in India in late January. The spread of the epidemic and the economic lockdown enacted in response have impacted the daily lives of nearly all Indians. Yet, tracking the economic impacts of the disease and resulting policies has been difficult due to a lack of comprehensive and representative data.
In this piece, we begin to address this gap using data from a nationally representative survey of Indian households by the Center for Monitoring Indian Economy (CMIE). We examine how incomes have changed since the epidemic began, how households are able to cope with their current economic circumstances, and how this varies across key socio-demographic characteristics, including pre-lockdown household income, place of residence, and religion.
We find a sharp and broad negative impact on household income — with nearly 84 percent of Indian households reporting decreases in income since the lockdown. Further, households have limited ability to cope with the current economic climate — only 66 percent of households report currently having the resources to go on for more than another week before facing distress.
Background on India’s Lockdown. Following a one-day curfew popularly known as the “Janta Curfew” on March, 22, 2020, the Government of India ordered a 21-day national lockdown to fight the spread of COVID-19 on March 24, 2020. The lockdown was first extended on April 14, and again on May 1, and is currently due to expire on May 17. Some states have already begun to extend the lockdown further into the end of May. During this time, most of India’s 1.3 billion residents have been required to stop working and shelter indoors, with only a few exceptions.[1]
Data. We analyze data collected by the Centre for Monitoring Indian Economy (CMIE) as part of its Consumer Pyramids Household Survey (CPHS). CPHS is a panel survey that usually surveys approximately 175,000 households across India every four months. CPHS has continued to run through the lockdown with roughly 45 percent of its usual sample. CMIE fielded two short-term questions to all surveyed respondents in the CPHS between April 18, 2020 and April 30, 2020. In total, 5,779 households were surveyed across 27 Indian states.[2]
The questions asked were:[3]
- Has the lockdown caused a fall in household income?[4]
- For how long can your household continue without borrowing or getting any help in cash or kind from anyone?[5]
We link answers to these questions to CPHS data on various characteristics of the households, including: per-capita household income [6], state, urban versus rural status, and the household religion. Importantly, we use monthly pre-lockdown per-capita household income to bin households into income quintiles.
Finding #1: 84 percent of Indian households have lost income due to the lockdown
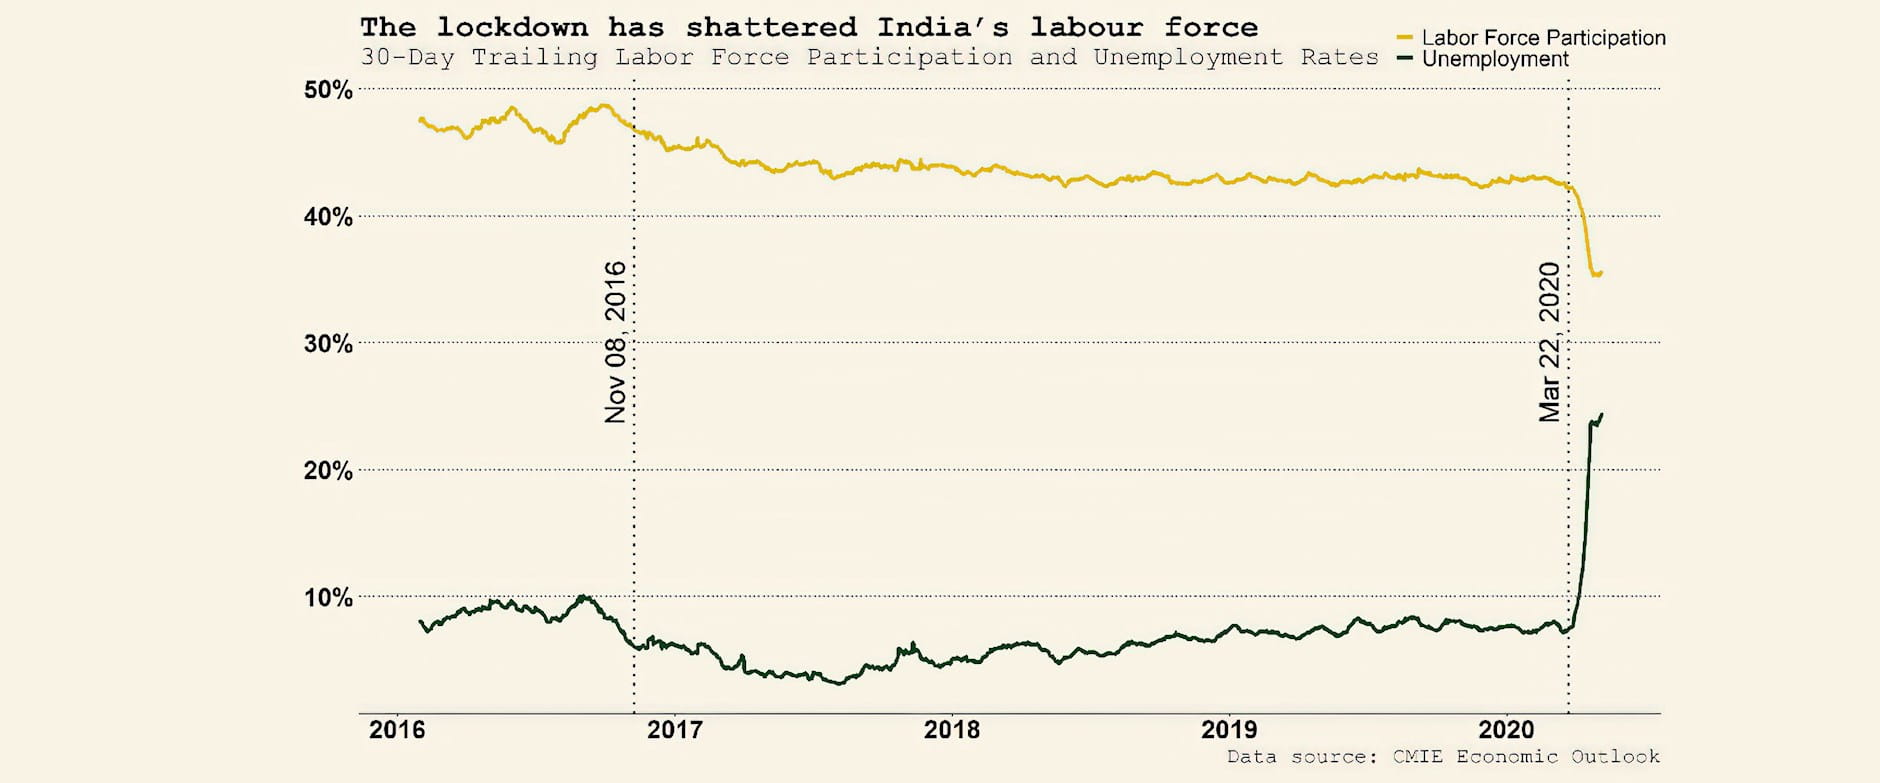
Across India, 84 percent of households reported a fall in income due to the lockdown. This fall in income is consistent with the sharp increase in unemployment and the sharp decrease in labour force participation that has been recorded in the CPHS data immediately after the lockdown went into effect, as seen in Figure 1. The unemployment rate reached 25.5 percent on May 5, from a base of 7.4 percent on March 21. The labour force participation rate dropped by 6.6 percentage points in the same period.
FIGURE 1
Finding #2: Households in the second and third quintiles of the income distribution are most severely affected
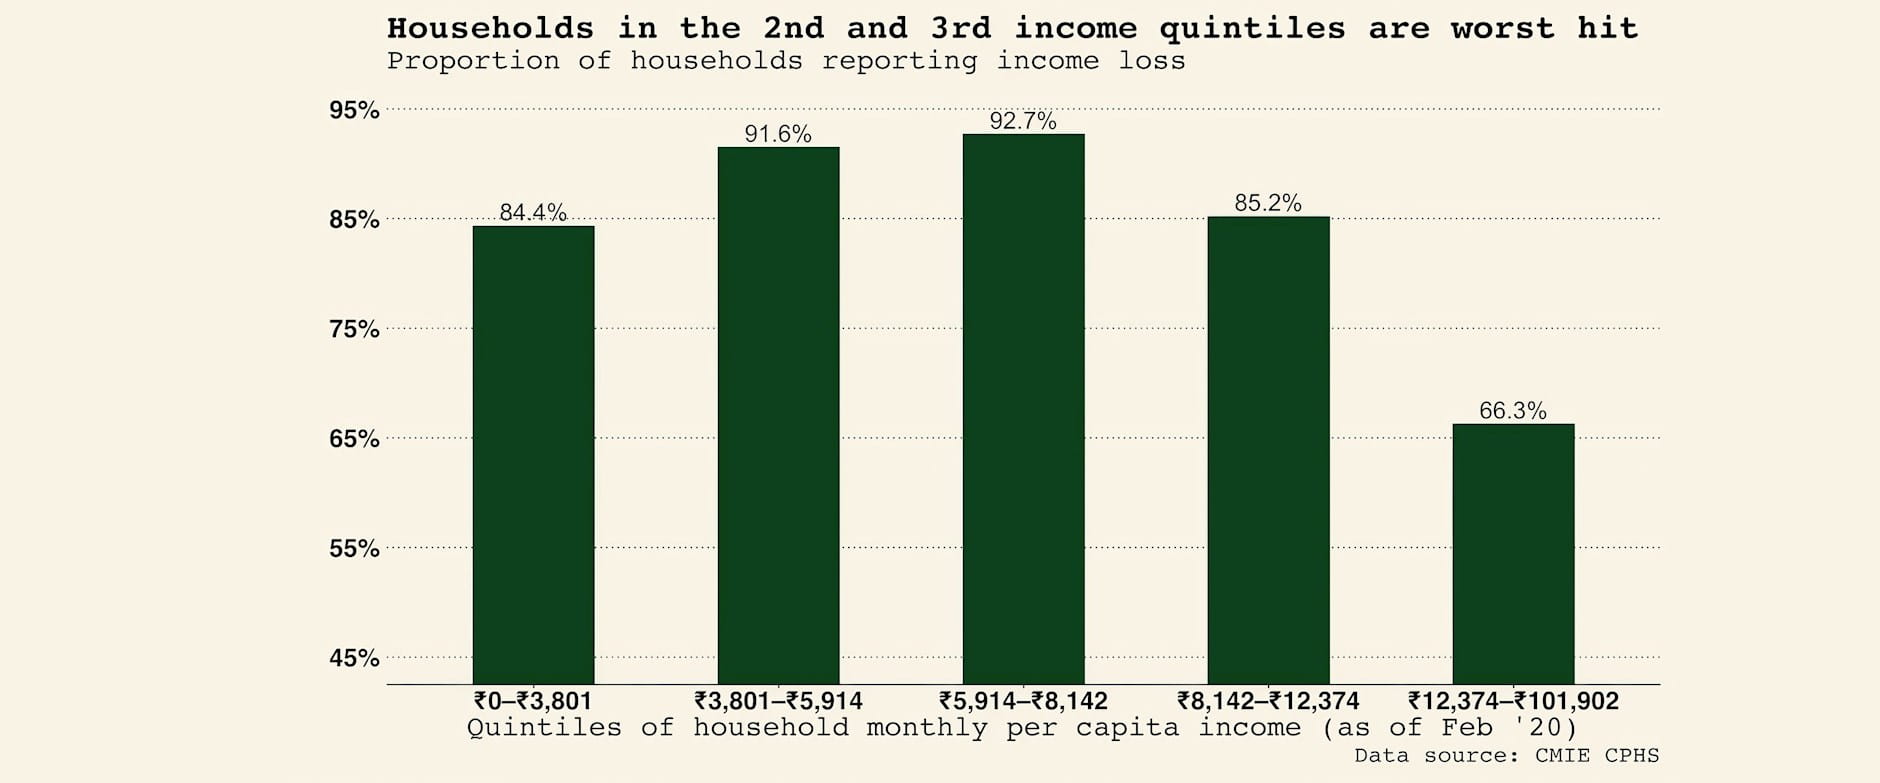
As shown in Figure 2, more than 90 percent of households in the second- and third-income quintiles pre-lockdown have experienced declines in income during the lockdown. While still exceptionally high, only about 85 percent of the lowest quintile and 66 percent of the highest quintile of households have experienced a fall in income compared to 93 percent in the remaining households with monthly per-capita incomes ranging between Rs. 3,801 and Rs. 12,374. The slightly lower rates of decline among the lowest income quintile are unusual, but the smaller impacts among better off households mirror what has been observed in other countries.
The disproportionate impact on households in the middle of the income distribution may partly be due to the fact that these households are most likely to be dependent on sources of income which are hit due to the lockdown. The households in the highest quintile are more likely to have stable salaried jobs, with the ability to work from home and continue to earn a living. Households in the lowest quintile may be more heavily concentrated in occupations that have continued despite the lockdown (e.g. agriculture, food vendors) or have benefited from targeted transfer programs. In contrast, the remaining households appear to be exposed to substantial job losses that have not been buffered by additional transfers.
FIGURE 2
Finding #3: Rural households have been hit hardest
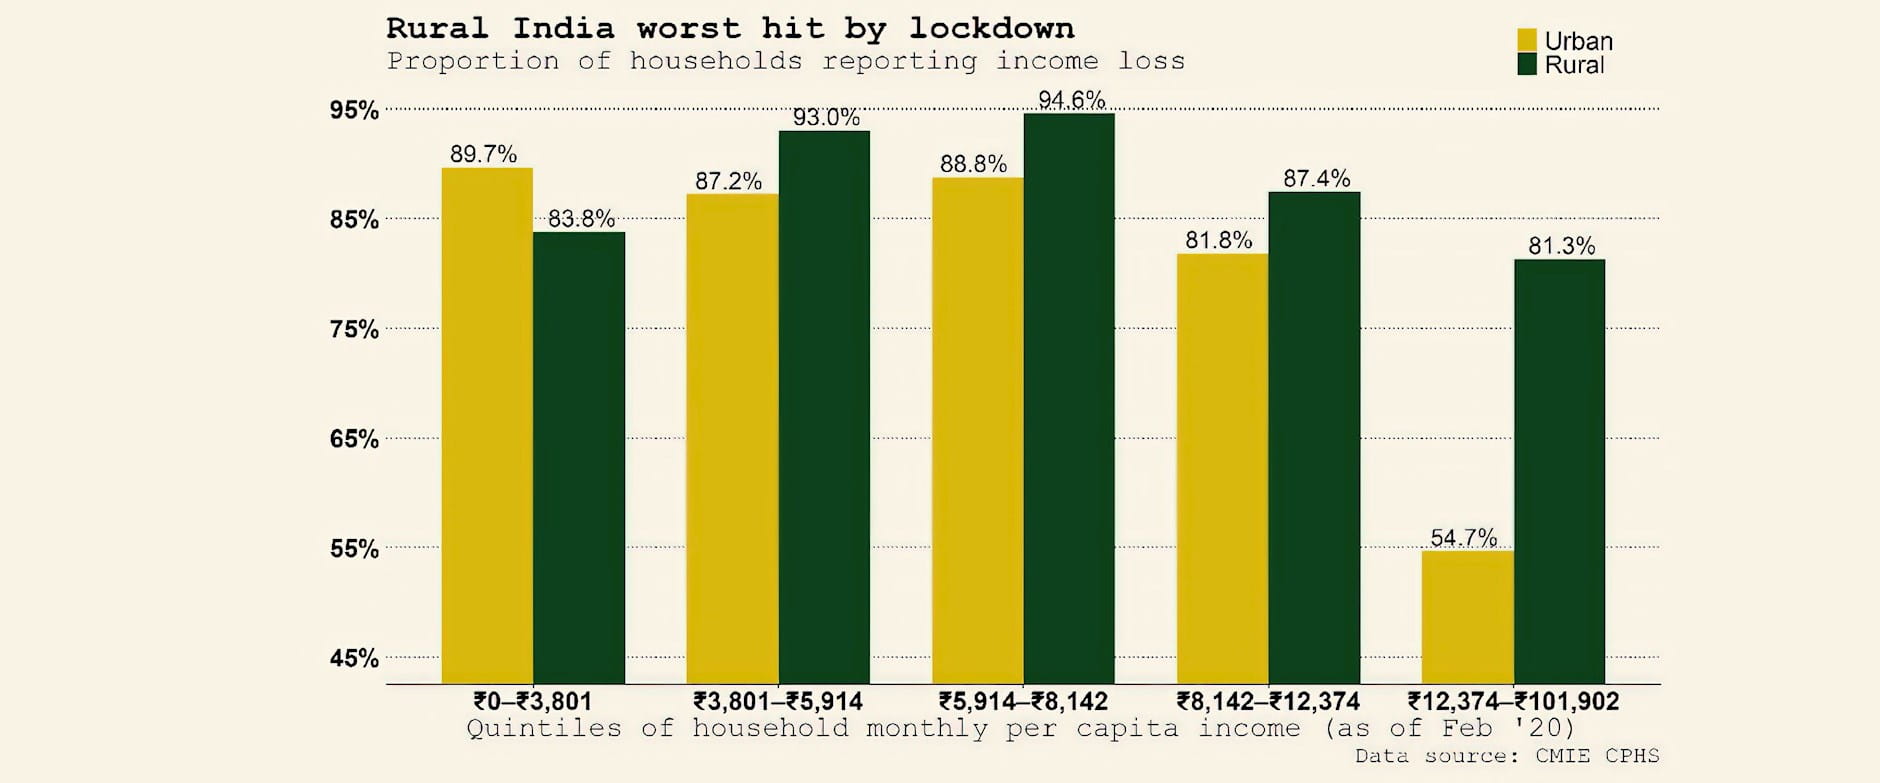
Rural households have been disproportionately negatively impacted. Some 88 percent of rural households report a fall in income under the lockdown, compared to 75 percent of urban households. This pattern is driven both by exceptionally high losses among the middle three quintiles of rural households as well as relatively higher losses among the highest income quintile among rural households.
Digging into the data further, Figure 3 suggests that the hump-shaped pattern seen in Figure 2 is driven by two distinct patterns. First, the protective effect found in the highest-income households is a predominately urban phenomenon. This data is consistent with the idea that salaried workers with the jobs where working from home is possible are relatively protected. In contrast, the highest earning quintile of rural households do not display nearly as much resilience, with 81 percent of rural high-earning households experiencing a decline in income.
Second, within the lowest income quintile, rural households appear to be driving the slight mitigation in declines. Declines in the lowest income quintile are still shockingly high at over 80 percent. However, they are still roughly 10 percentage points lower than the rate of declines among second quintile rural households. These differences may be due to occupational differences or transfers either by the state or through social networks—channels we are working to parse out in ongoing work with additional data.
FIGURE 3
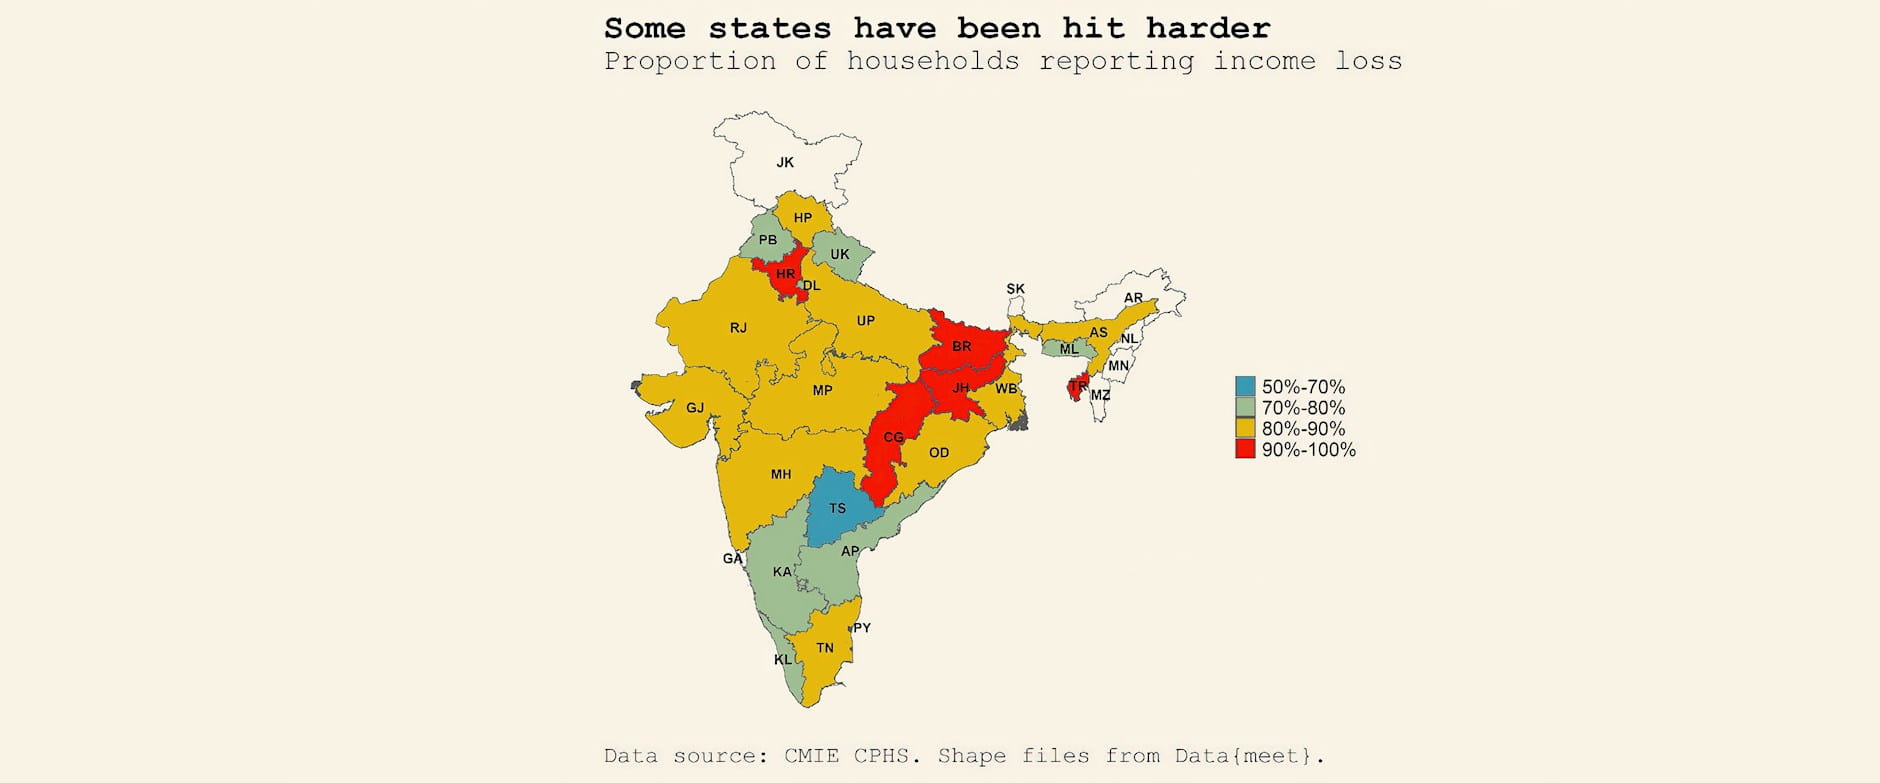
Finding #4: Some states have been hit harder than others
In addition to variation in income declines by urbanicity, there is substantial variation in declines by state of residence. Figure 4 reports on the differential economic exposure to the lockdown across Indian states.[7] Among the states with sufficient data,[8] the five least affected states are Telangana, Puducherry, Karnataka, Punjab, and Delhi. The five most affected states are Tripura, Chhattisgarh, Bihar, Jharkhand, and Haryana.
Notably, the declines in income do not strongly track the extent of the outbreak. Rather, income per-capita before the lockdown, lockdown severity, and the effectiveness of the delivery of aid are likely contributors. Further data is being analyzed to better understand the possible drivers of this geographic variation, including initial economic conditions in the state, agricultural production prior and during lockdown, severity of the implementation of the lockdown measures, and various measures of state capacity.
FIGURE 4
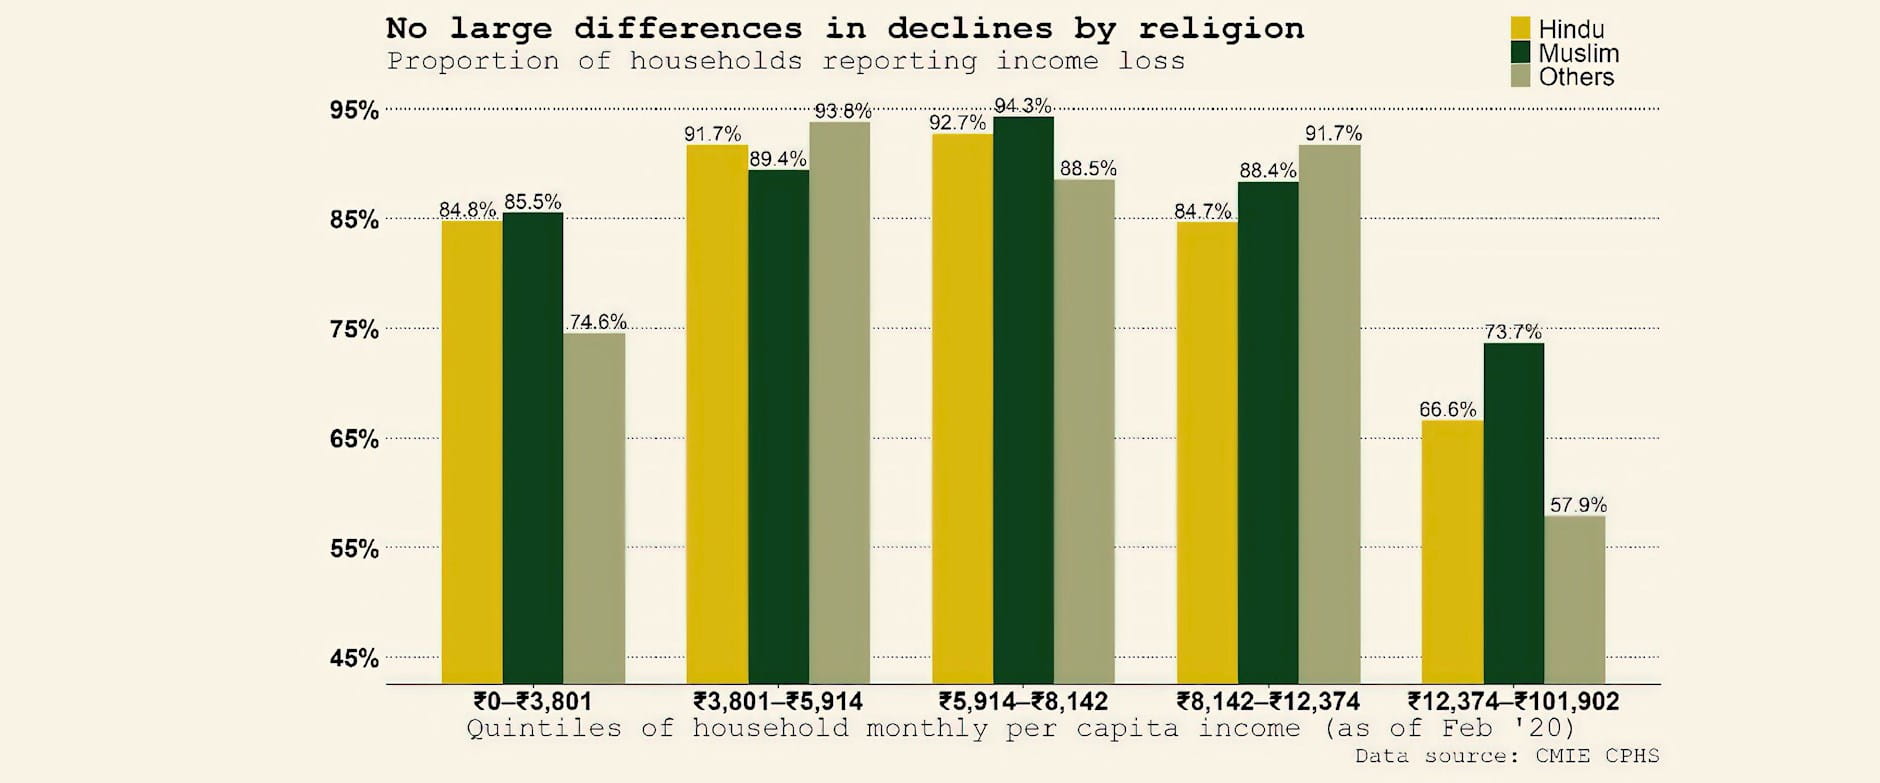
Finding #5: No large differences in declines in income by religion
The impact of the lockdown only varies modestly with a household’s religion. As shown in Figure 5, similar shares of Hindus and Muslims are affected by the lockdown across income quintiles. While there appear to be slight differences in declines in the highest and lowest income households of other religions — when compared to Hindus and Muslims — this data is relatively sparse making it difficult to draw strong conclusions.
FIGURE 5
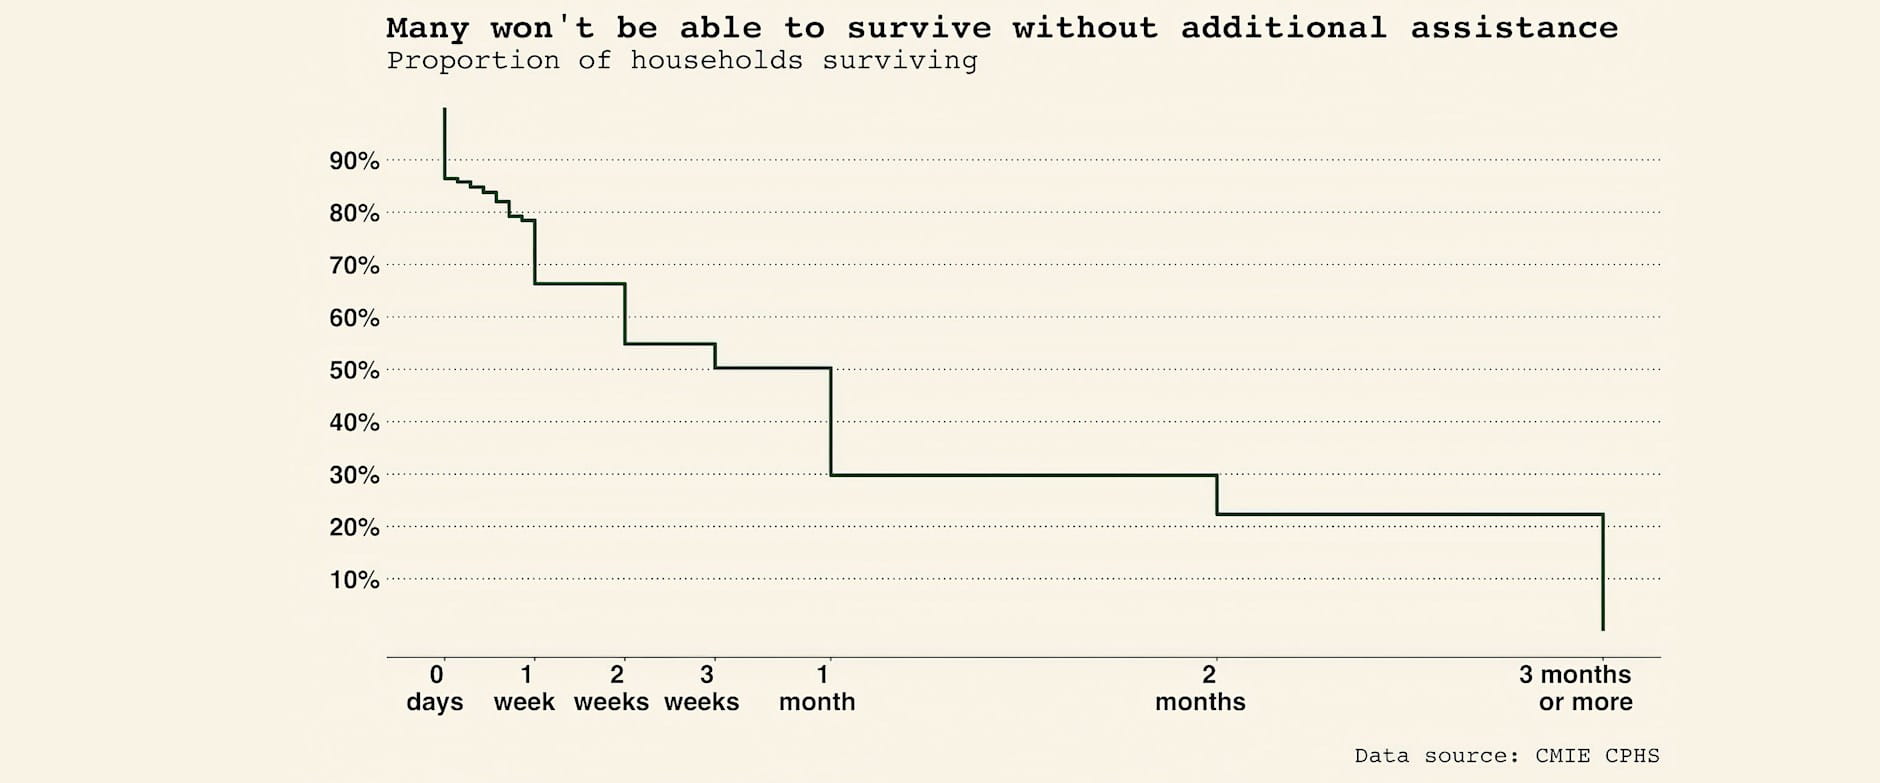
Finding #6: Many households won’t survive much longer without additional assistance
Given the low baseline wealth of many households, a very large share of Indian households state that they will be unable to continue — even over relatively short periods — without additional assistance. Across India, 34 percent of all households report being able to survive for no more than one week without additional assistance.
To better understand a household’s ability to operate without additional funds, we plot Figure 6. The grey line indicates what fraction of the population is unable to survive beyond the number of days indicated on the horizontal-axis. For example, only 30 percent of households are able to survive one month or more without additional assistance. Crucially, 14 percent of the sample is already out of funds and risks immediate and severe deprivation if they are unable to borrow or receive additional benefits. These figures suggest that the rapid distribution of in-kind or cash transfers is needed to prevent a sharp increase in malnutrition and severe deprivation. Such transfers will also likely promote a more robust recovery as the country is able to reopen.
FIGURE 6
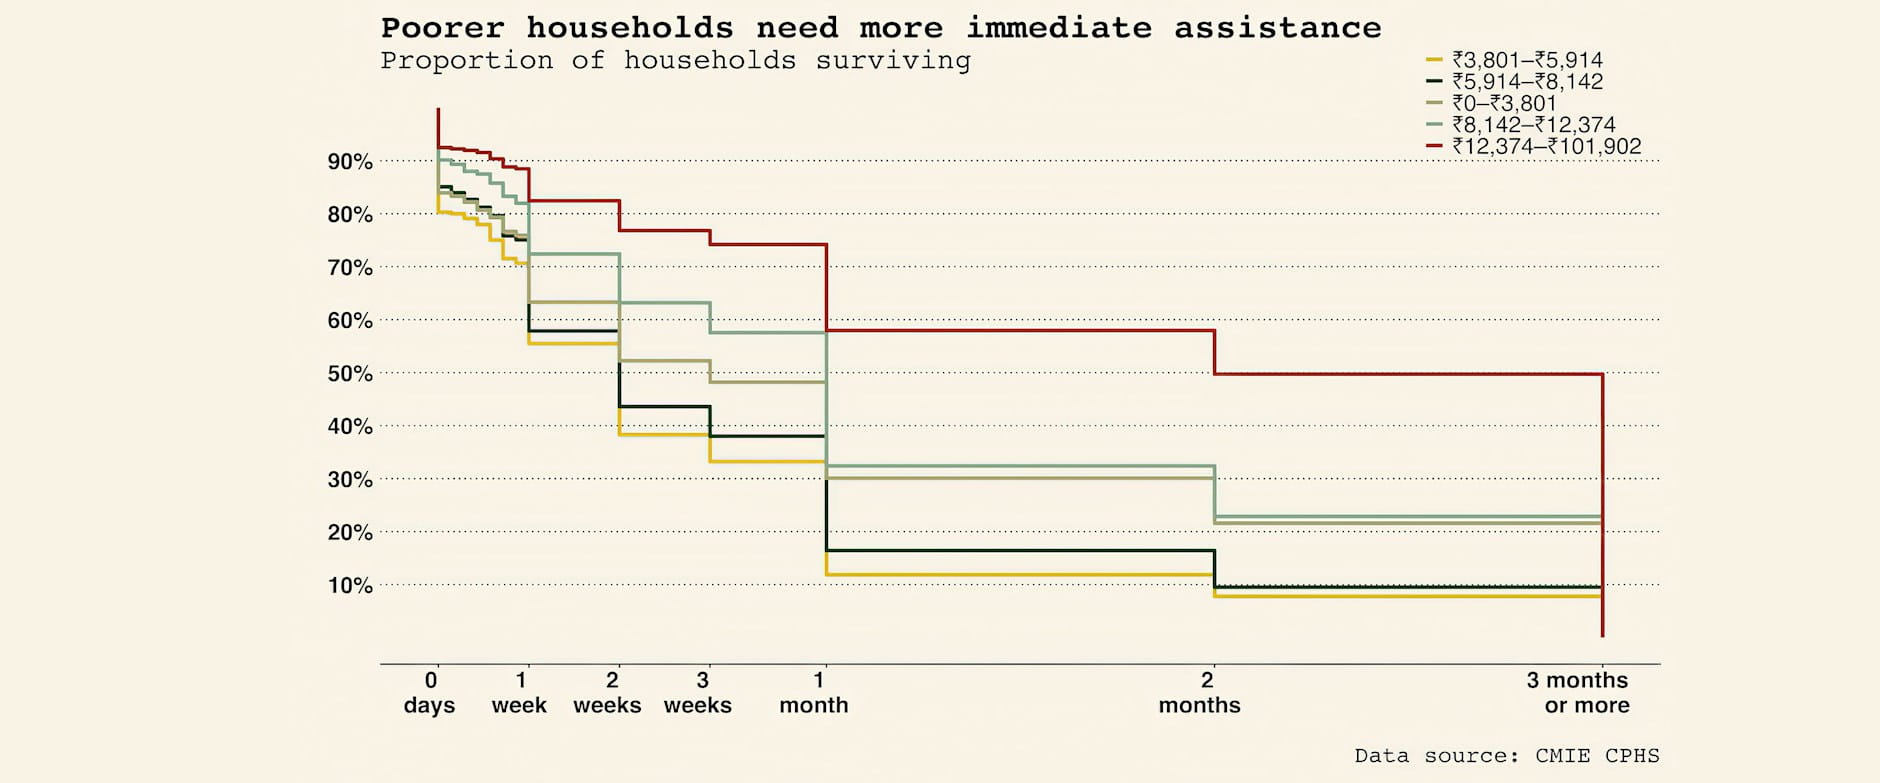
Finding #7: Households lower in the income distribution are in more immediate need of additional resources
Not surprisingly, as shown in Figure 7, all except households in the highest income quintile face an extreme economic crunch, with nearly one-third of those in the lowest three income quintiles reporting being able to survive for no more than seven days without additional assistance. It is interesting to note again that households in the second and third income quintiles report greater difficulty than those in the very lowest one. In total, only 22 percent of this group anticipates being able to continue one month without additional assistance. These figures highlight the importance of state aid in keeping households going until economic activity picks up.[9]
FIGURE 7
Finding #8: The need for additional resources varies significantly with geography
The need for additional resources is also affected by where the household is located. As can be seen in Figure 8, on average, the urban poor have the least time before their resources are depleted.Of below median income households, [10] 65 percent of urban households have resources sufficient for no more than two weeks while 54 percent of rural households have resources sufficient for the same period of time. This pattern is reversed among households in the top half of the income distribution.
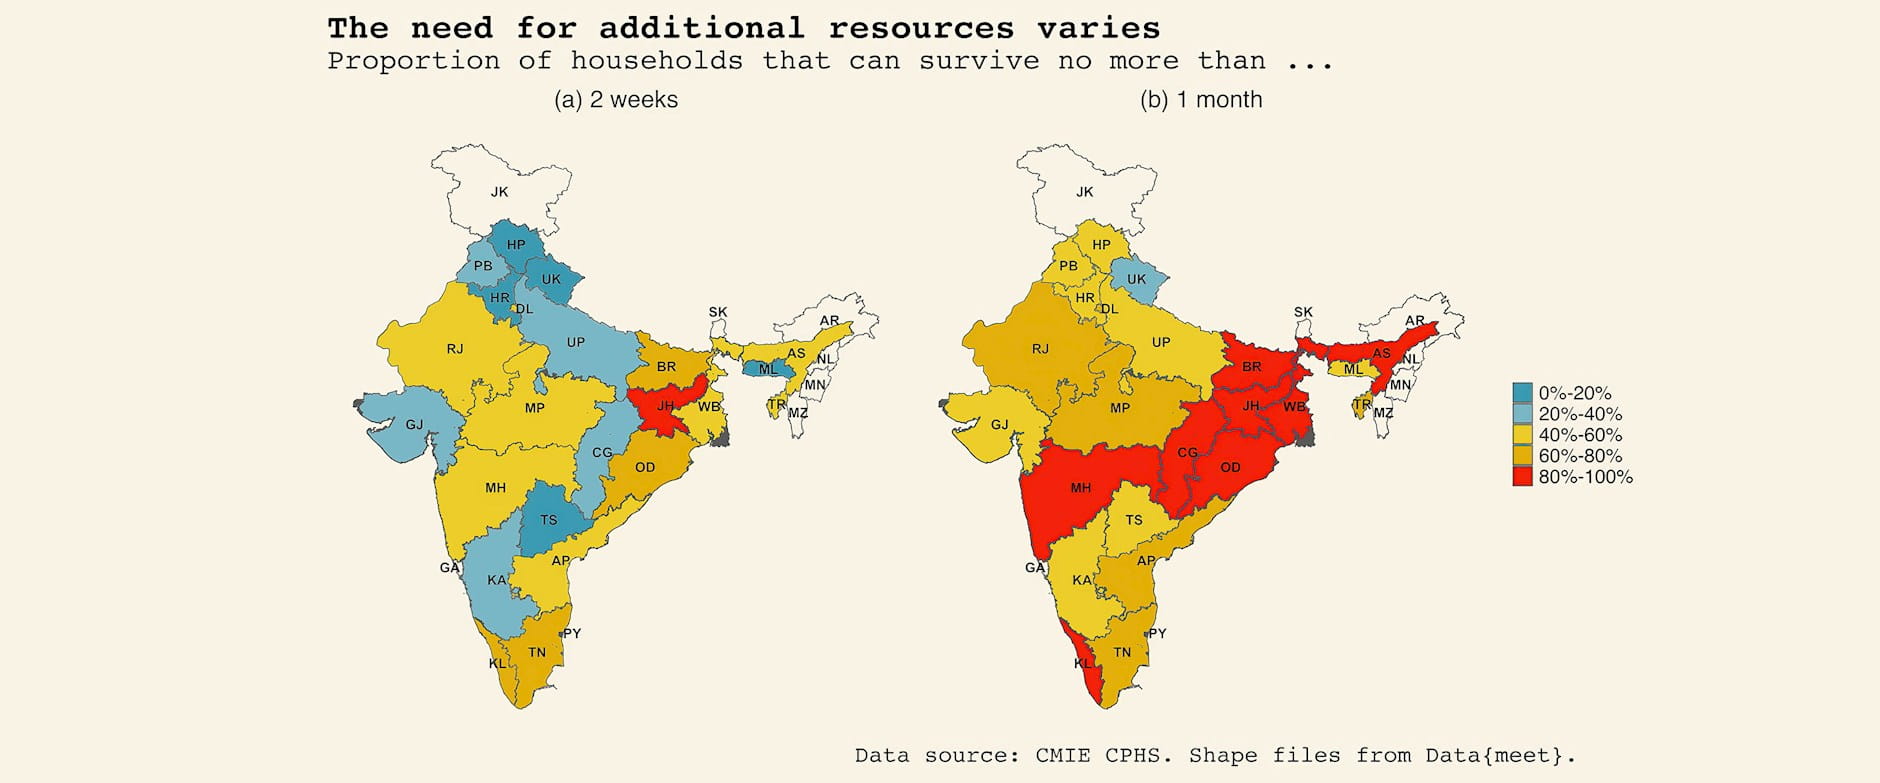
In addition to variation in need by urbanicity, there is significant variation in need by state of residence. Figure 9(a) shows, across Indian states, the proportion of households that can survive two weeks or less without cash or in-kind help. Figure 9(b) is the same, but considers a one-month time horizon. The five states with households in most urgent need for funds—based upon two week survival—are Jharkhand, Bihar, Odisha, Tamil Nadu, and Kerala. Himachal Pradesh, Uttarakhand, Meghalaya, Haryana, and Telangana are among the most resilient over a two-week period. However, taken together these figures highlight that the need for resources—such as sustained and broad base of transfers—is urgent as nearly all households will be unable to survive without transfers in the medium-run.
FIGURE 8
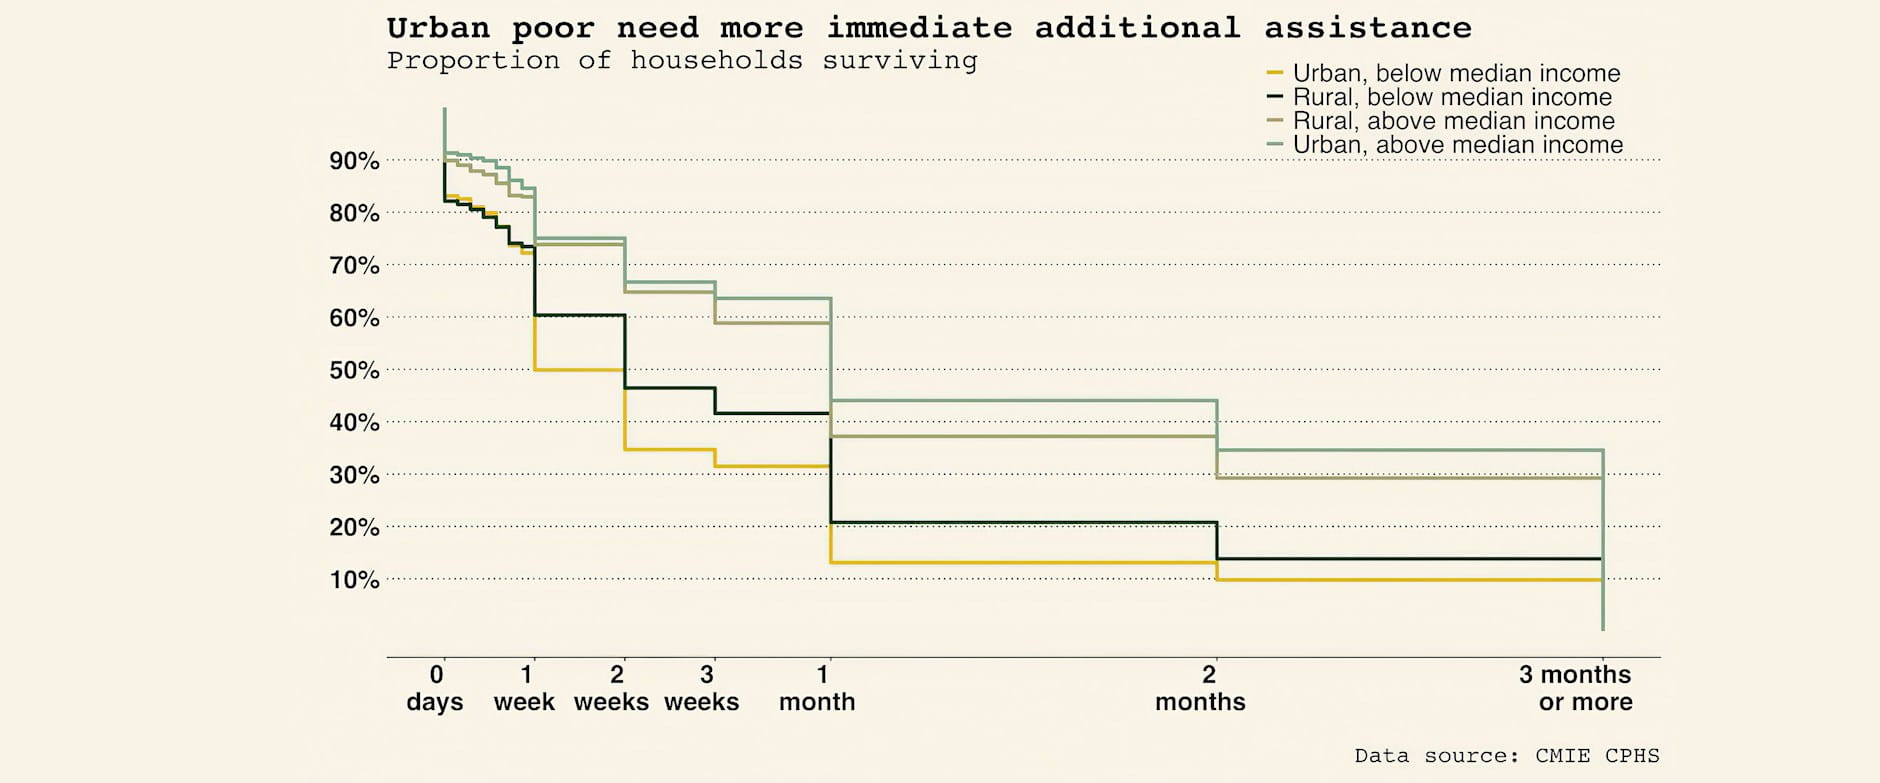
FIGURE 9
Check back to Rustandy's Coronavirus Social Impact Research page for the latest results. Read the press announcement.
Authors
Marianne Bertrand, Chris P. Dialynas Distinguished Service Professor of Economics,University of Chicago Booth School of Business, and Faculty Director, Chicago Booth's Rustandy Center for Social Sector Innovation and UChicago’s Poverty Lab;Kaushik Krishnan, Chief Economist, Centre for Monitoring Indian Economy (CMIE); and Heather Schofield, Assistant Professor, Perelman School of Medicine and The Wharton Schoolat the University of Pennsylvania. Emails: marianne.bertrand@chicagobooth.edu; kkrishnan@cmie.com; hschof@wharton.upenn.edu
Acknowledgements
We thank Shreya Agarwal, Gabriel Jardanovski, Devika Lakhote, and Feng Lin for excellent research assistance.
[1]Exceptions were granted to select government ministries and departments, commercial establishments such as ration shops (under Public Distribution System), essential telecommunication services and banks, units engaged in manufacturing and transportation of essential commodities, and other emergency services.
[2]CPHS is conducted across the country, except in Arunachal Pradesh, Nagaland, Manipur, Mizoram, Andaman & Nicobar Islands, Lakshadweep, Dadra & Nagar Haveli and Daman & Diu. Some parts of Jharkhand and Chhattisgarh are no longer surveyed due to concerns for CMIE staff safety. Ladakh is also not surveyed as it is not accessible year-round.
[3]The responses from this short-term survey will be available to subscribers of the CPHS data delivery service, CPdx.
[4]Potential answers to this question were“Yes”or“No”.
[5]Potential answers to this question were “0 day”, “1 day”, “2 days,”3 days”, “4 days”, “5 days”, “6 days”, “1 week”, “2weeks”, “3 weeks”, “1 month”, “2 months”, “3 months or more”.
[6] Pre-lockdown income is measured by a household’s total income in February, 2020. Per-capita income is computed as total household income / sqrt(household size). The computed quintiles correspond to Rs.0–Rs.3,801, Rs.3,801¬–Rs.5,914, Rs.5,914–Rs.8,142, Rs.8,142–Rs.12,374 and Rs.12,374–Rs.101,902 respectively. Care should be taken in attaching labels to these groups. For example, though the quintile ranging from Rs.5,914–Rs.8,142 is the middle quintile, it may be misleading to describe these households as middle-income or middle-class. Similarly the highest quintile starts at Rs.12,374 per-capita per-month, which again does map well to commonly held notions of what the “richest” households in India might be.
[7] Figures 4 and 9are made using shapefiles for India from Community Created Maps of India by Data{meet}. These shape files depictISO countries and not sovereign states. We do not claim these to be maps that accurately depict India’s sovereign or internal political borders. Any queries or issues regarding these shape files should be directed to Data{meet}.
[8] Other than the regions that are not usually surveyed in CPHS(seenote 1 above), we have dropped states with less than 50 observations from our analysis when producing state-level statistics. While CPHS is representative at the state level, the operational constraints of surveying under a lockdown meant that some states were not adequately covered in the 13-day window for which the two survey questions ran. The states dropped areJammu and Kashmir(2),Goa(33)andSikkim (36)where the numbers in parentheses are the sample sizes for those states.
[9]CMIE is currently running a longer-run survey developed in partnership with Dvara Research Foundation and with inputs from the World Bank to measure the extent to which households are able to make use of state welfare benefits and analysis of this data will begin soon.
[10]Median household per-capita monthly income is Rs. 6,928.

![]()
![]()

![]()