
Measuring the Labor Market Since the Onset of the COVID-19 Crisis
- By
- August 04, 2020
- Rustandy Center for Social Sector Innovation
Week 1: Labor Market Impacts of COVID-19 on Hourly Workers in Small- and Medium-Sized Businesses
Week 2: Update with Homebase Data Through April 11
Week 3 and 4: Update with Homebase Data Through April 25
Week 5 and 6: Update with Homebase Data Through May 9
Week 7 and 8: Update with Homebase Data Through May 23
Below, we update our analysis of the labor market impacts of COVID-19 on small- and medium-sized businesses using Homebase time-card records and data collected between February and August 2020.
To read our latest working paper, click here. We will continue to update these facts, tracking patterns and adding new information as the COVID-19 situation develops. An up-to-date version of this summary will be maintained here.
Fact #1: THE RECOVERY HAS PLATEAUED
The U.S. labor market collapsed over roughly two weeks in late March and early April. Since then, we have tracked a fairly steady recovery in work hours at Homebase firms. A substantial share of firms that closed reopened and many workers were reemployed.
Since we authored our first post, we’ve also documented employment changes measured by government surveys of both workers and firms—the Current Population Survey (CPS) and Current Employment Statistics (CES)—as well as Kronos, another private provider of time clock software similar to Homebase. Each data source tells roughly the same story, though not quite as dramatically as Homebase.
Since mid-June, however, as COVID-19 cases resurged in several regions of the country, this recovery has plateaued. Hours worked at Homebase firms as a share of the January baseline peaked in June and have remained flat throughout July (Figure 1).
Figure 2 plots the evolution of total hours per week worked among firms in our sample from mid-January to late July. Each sub-plot shows the distribution of hours across firms, measuring each firm relative to its average hours per week in a base period of Jan 19-Feb 1. By the week of March 15, the distribution shifts dramatically left, reflecting the collapse of the labor market between March and April. At the height of the crisis, over 40 percent of firms in our sample were shut down entirely. Between April and June, the share of firms reporting zero hours worked ticked down each week, and the distribution shifted back to the right. However, the final five frames, capturing weeks between late June and late July, show that this recovery appears to have stagnated. The share of firms that remain closed stalled at just over 20 percent. Indeed, in the last week, the share closed ticked upwards for the first time since April.
FIGURE 1: Employment trends since January 2020 using four data sources
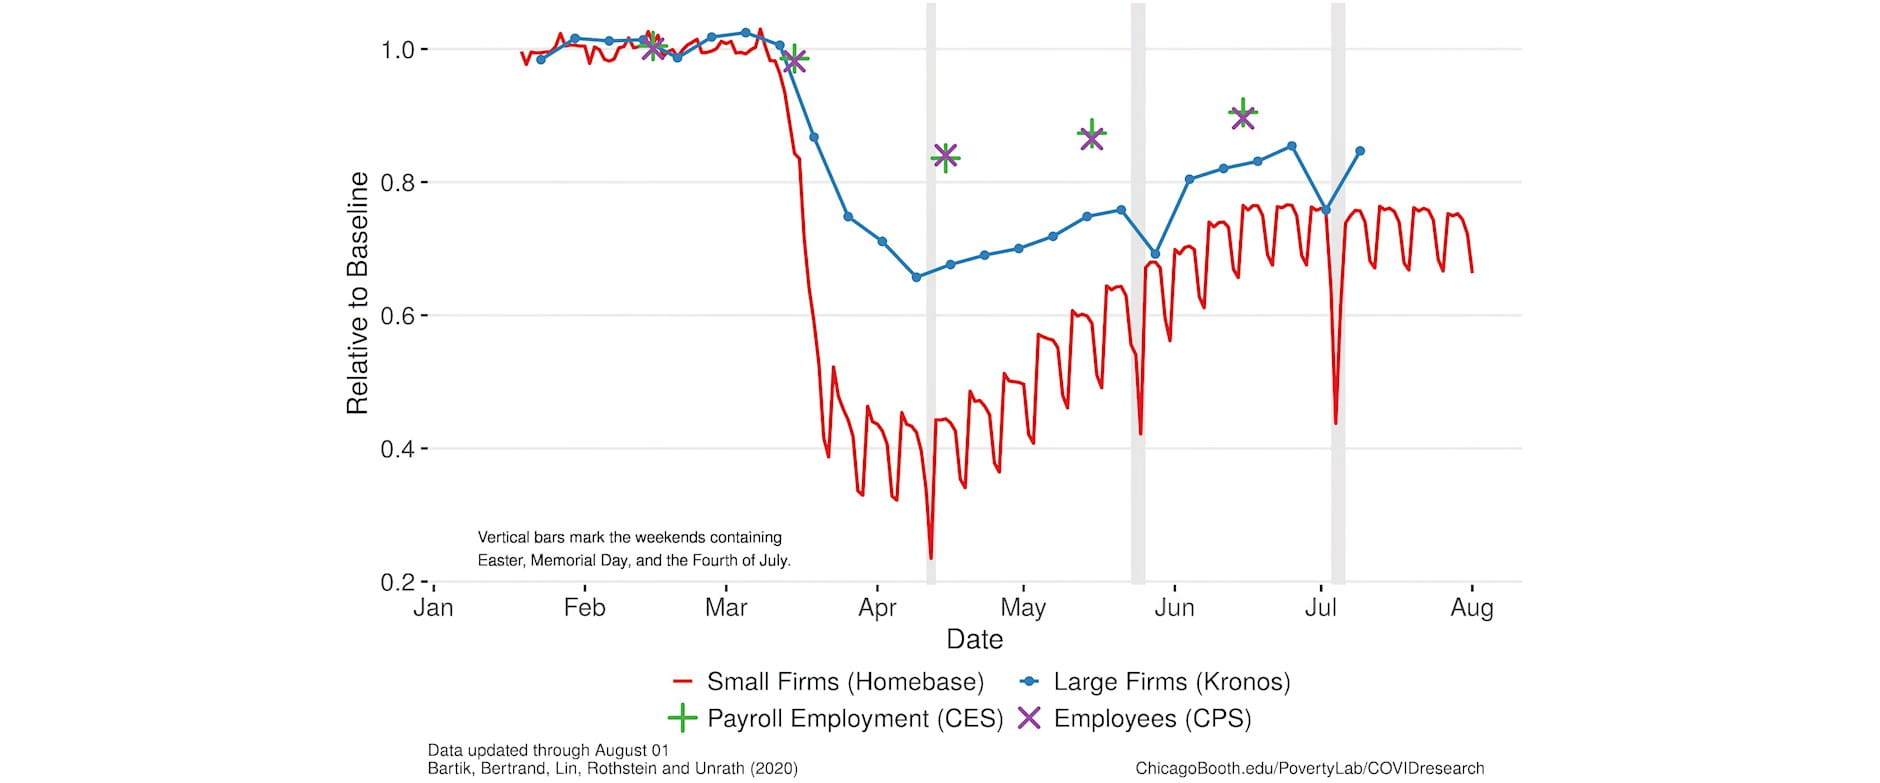
FIGURE 2: Ratio of total weekly hours worked at each firm to weekly hours worked between January 19 and February 1
Fact #2: THE PLATEAU IS DUE TO FIRMS NO LONGER REOPENING AND REOPENED FIRMS NO LONGER RESTORING HOURS.
As in previous updates, we decompose the loss of hours each week relative to the January baseline into three sources: firms that remain shutdown, hours cuts for retained workers at open firms, and layoffs.
Figure 3 reports the percent change in hours each week since early February attributable to these three channels. Except for the first week of the labor market collapse [1], reductions in hours per worker as defined above have accounted for a very minor part of the change in total hours at Homebase businesses. Instead, the decline in total hours came primarily from firms that closed entirely and from reductions in the number of workers at continuing firms. Layoffs accounted for a larger share in March and shutdowns in April, but thereafter the two have had about the same quantitative impact on missing hours.
Between the end of April and late June, firms gradually reopened and restored their employees’ hours. However, since late June, reopenings and hours restoration have stalled. Since mid-June, we see neither net reopening of previously closed firms nor growth of those that have reopened.
FIGURE 3: Hours changes at Homebase firms each week, relative to Jan 19-Feb 1, decomposed into firm shutdowns, layoffs and hours reductions
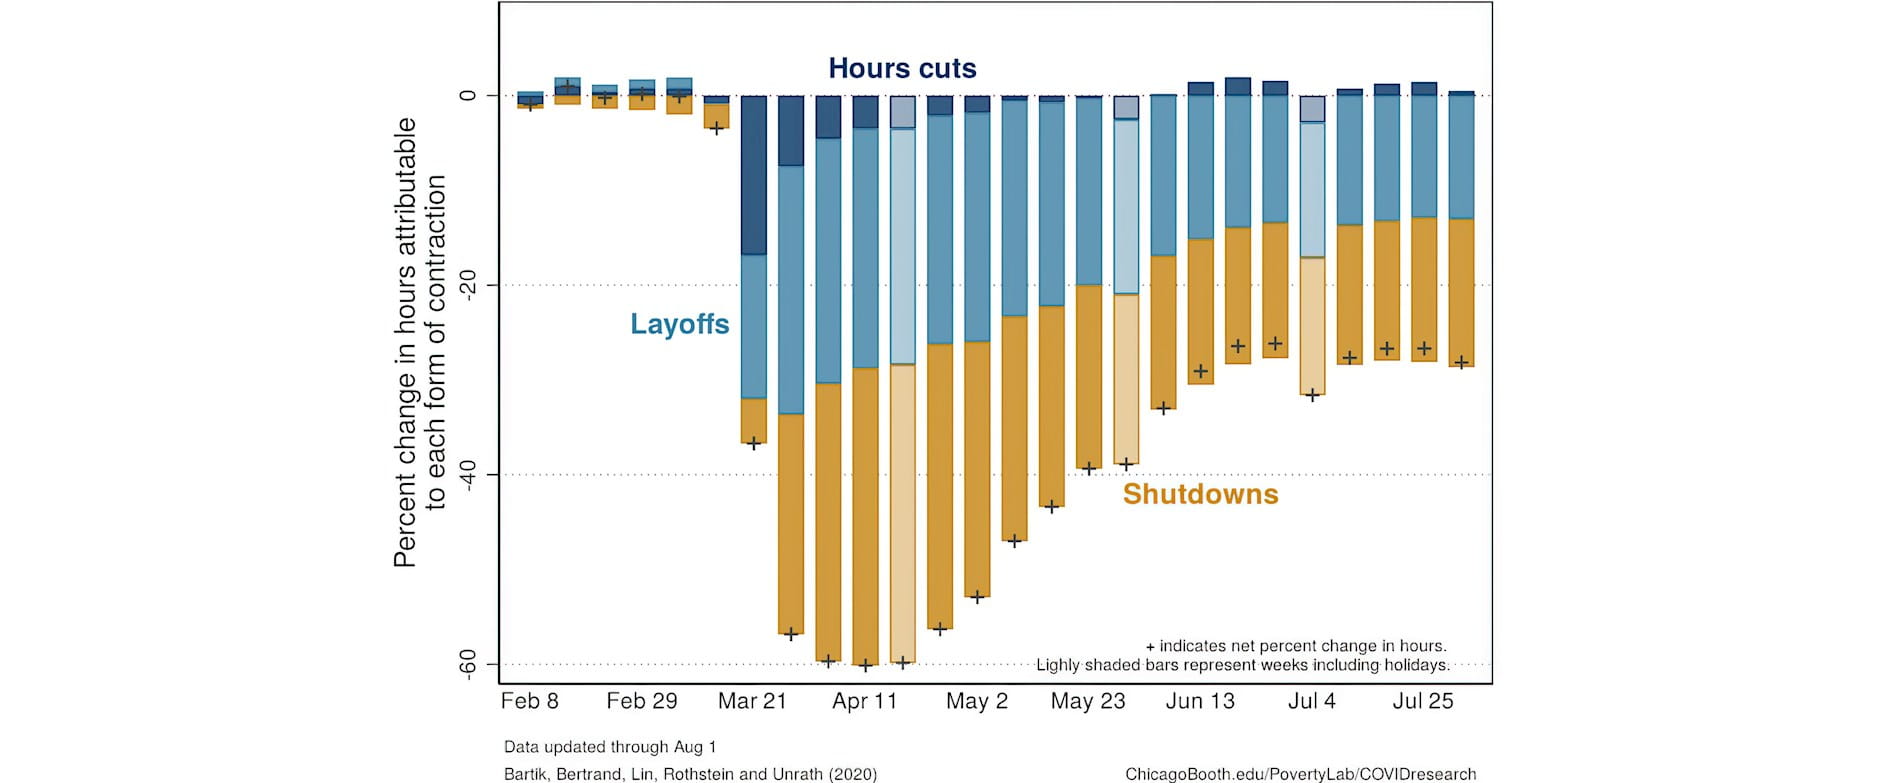
[1] The large role for hours reductions in this week is an artifact created by mid-week layoffs or firm closings. When workers stop working in the middle of a week, our method counts that as a reduction in weekly hours that week and as a layoff or firm closing the following week.
Fact #3: HOURS REDUCTIONS IN JULY WERE MORE SEVERE IN STATES WITH RISING COVID-19 CASELOADS.
Unsurprisingly, the stalled recovery appears related to the recent rise in caseloads across the country.
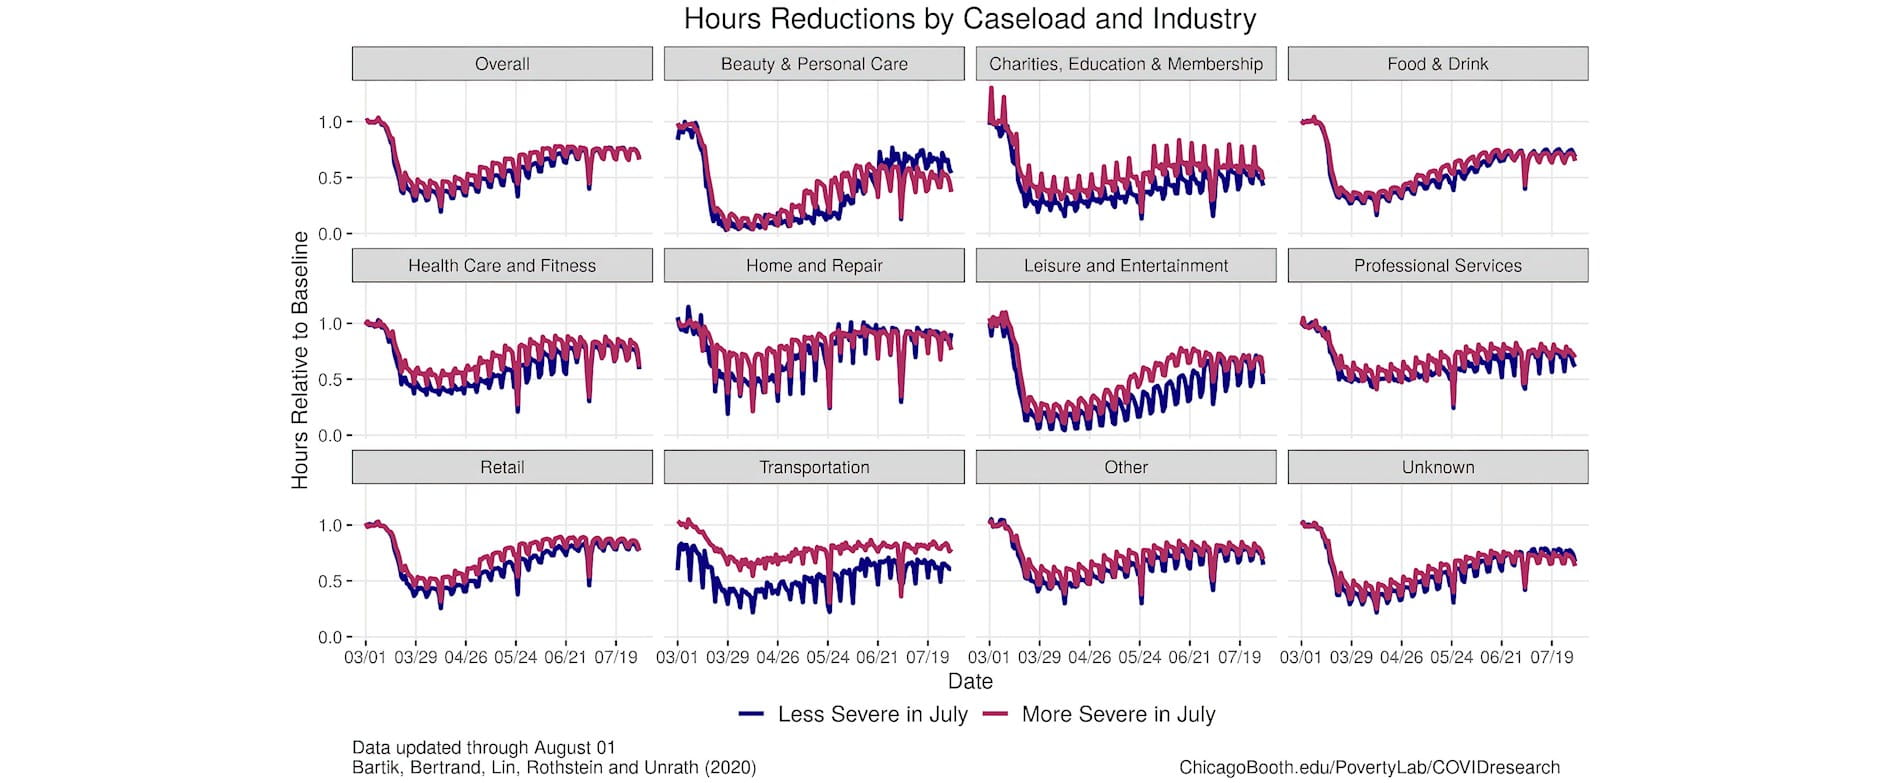
Figure 4 plots the changes in hours at Homebase firms relative to the January baseline, within industry, separated into states with growing versus decreasing caseloads. In states where cases have recently surged, initial outbreaks were less severe, and one can see that the hours declines in those states were not as large. These states also saw faster recoveries in May. However, that pattern reversed by July. The effect of rising caseloads is most visible at leisure and entertainment establishments and beauty and personal care businesses, where hours started trending downward in these states by late June. Hours declines were large enough in states with rising caseloads that, for most industries, the overall hours declines have largely converged between the groups.
While July hours reductions were largest in states where caseloads have been rising, the recovery also appears to have stagnated in states where caseloads were similar or falling.
FIGURE 4: Hours reductions each day relative to baseline by industry and trends in state caseload
FACT #4: AT FIRMS THAT HAVE REOPENED, MOST HOURS ARE STILL BEING WORKED BY WORKERS EMPLOYED BY THE FIRM PRE-SHUTDOWN.
Of the roughly 42,000 unique firms in our baseline sample, approximately half (around 21,000) shutdown for at least one week in March or April. Of these firms that ever shut down, almost 13,000 have reopened and remained open through the week ending on August 1. In Figure 5, we show how much these firms’ baseline hours and workforce were restored through each week. By last week, these reopened firms had collectively regained about 70 percent of their baseline hours and employment levels. Almost 75 percent of this reemployment came through rehiring employees who worked at the firms before they shut down, and 25 percent from new hires. The share of hours worked by new hires has increased steadily each week since early May.
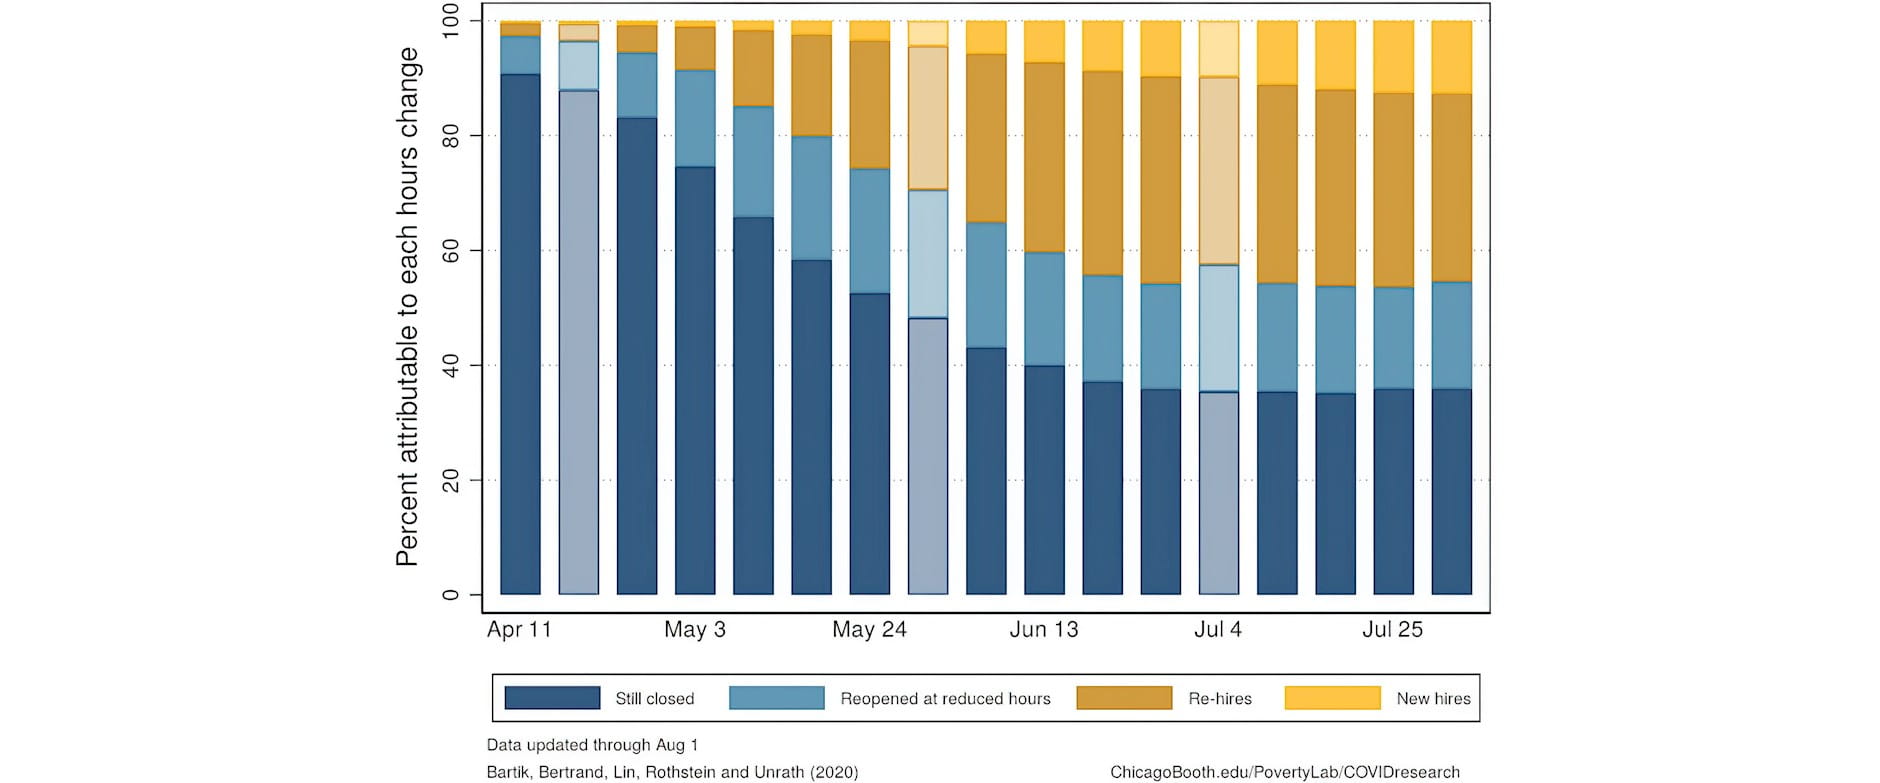
Figure 6 shows how hours have been restored (or are still missing) among firms that shut down before April 4. Across these firms, about 35 percent of their collective baseline hours remain missing due to ongoing firm closures. Another 20 percent of hours are lost because reopened firms are operating at reduced scale. The remaining share represents hours restored at reopened firms, which is split between old and new employees. Again, the gradual recovery we witnessed between April and June seems to have plateaued in July. The share of firms that have reopened has stagnated, and the share of original employees brought back has fallen slightly.
FIGURE 5: Percent of hours restored at reopened Homebase firms, relative to Jan 19-Feb 1, separated into those worked by rehires versus new hires
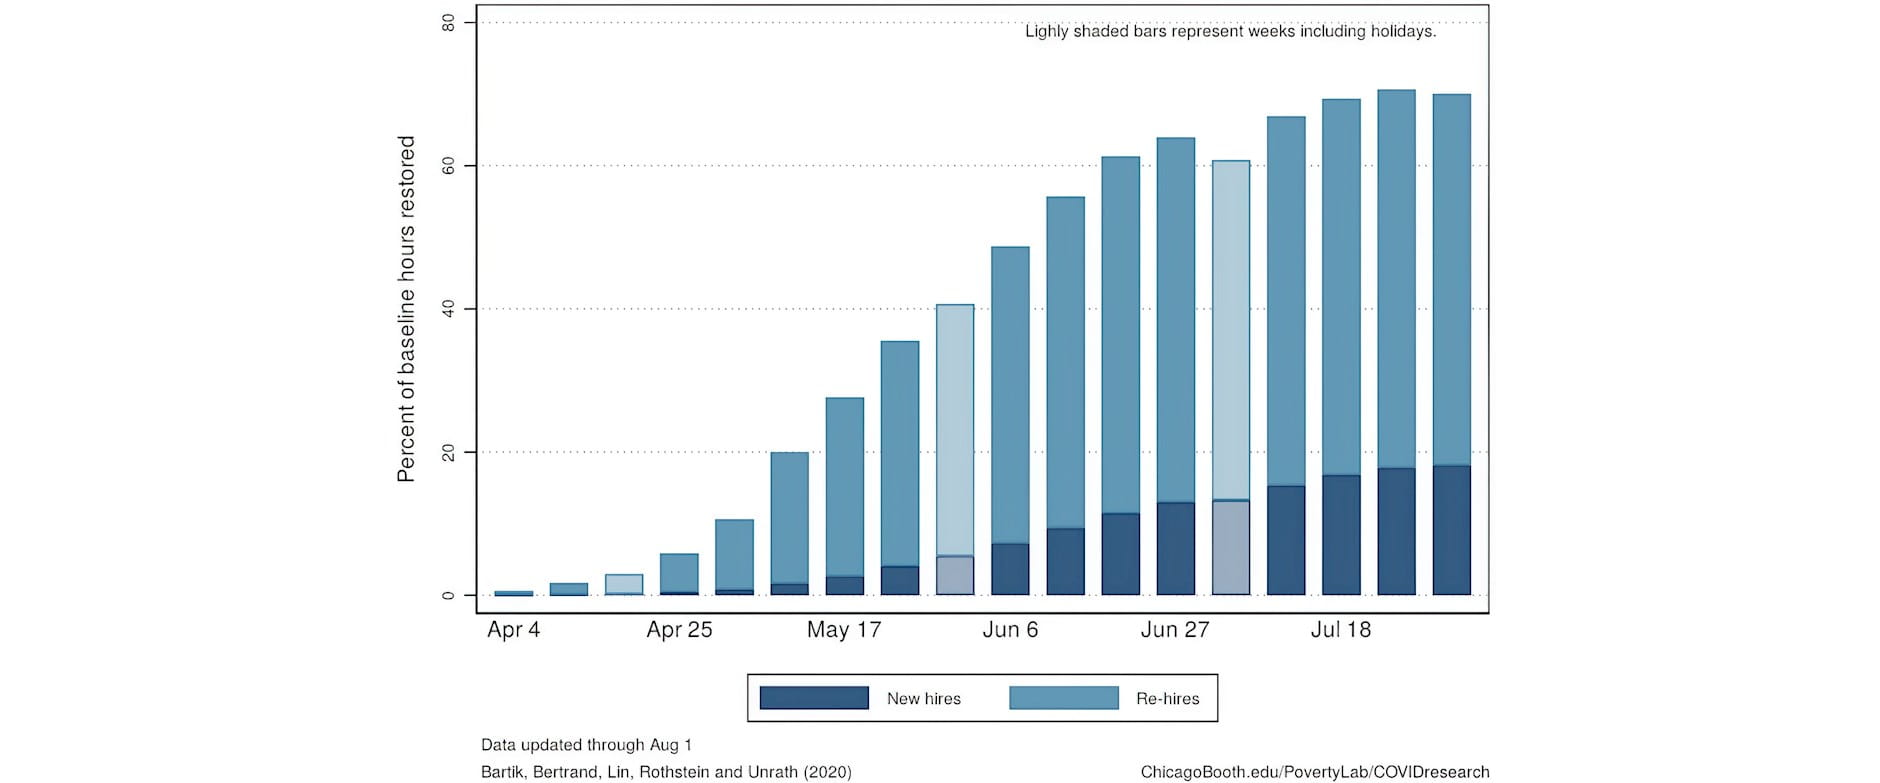
FIGURE 6: Distribution of hours changes, relative to Jan 19-Feb 1, among firms shutdown by Apr 4, separated into firms still closed, hours reductions at reopened firms, hours worked by rehired and new employees
METHODOLOGY
Our analyses are based on data on hours worked at the establishment-worker-day level generously made available by Homebase. These data extend from January 1, 2020 through August 1, 2020, 2020. We aggregate the Homebase data to the firm-MSA-industry-day level.We restrict the sample to firms whose employees worked at least 80 hours between January 19 and February 1 and to states for which we observe at least 50 such firms. We refer to this two-week window as the “base period.”
In our analyses of weekly outcomes, we normalize each firm’s hours by dividing by the average hours worked per week over the base period at the firm. In our analyses of daily outcomes, we normalize by dividing by the average value of the outcome at the given firm on the same day of the week during our base period.For example, if total hours for a firm on Friday, March 13 was 100 and total hours for the same firm on Friday, January 24 and Friday, January 31 was 300, (150 on each day), the outcome variable total hours’ value would be .66. (This is 100 divided by (300/2), the average Friday hours in the base period.)
We say that a state is hit harder by COVID in July if we reject the null hypothesis that the mean daily new cases in the last two weeks of July is less than or equal to that in the last two weeks of April at the 5 percent significance level. The COVID caseload data is from USAFacts.
Check back to Rustandy's Coronavirus Social Impact Research page for the latest results. Read the press announcement.
Authors
Alexander W. Bartik, Assistant Professor Economics, University of Illinois at Urbana-Champaign, and Research Affiliate, UChicago’s Poverty Lab; Marianne Bertrand, Chris P. Dialynas Distinguished Service Professor of Economics, University of Chicago Booth School of Business, and Faculty Director, Chicago Booth's Rustandy Center for Social Sector Innovation and UChicago’s Poverty Lab; Feng Lin, PhD Student, University of Chicago; Jesse Rothstein, Professor of Public Policy and Economics, University of California, Berkeley, and Director, California Policy Lab; and Matt Unrath, PhD Candidate, Goldman School of Public Policy, UC Berkeley, and Research Fellow, California Policy Lab
Acknowledgements
We thank Homebase and Ray Sandza in particular for generously allowing access to their data and sharing their time to answer questions and help us understand the data. We also thank Jingwei Maggie Li, Salma Nassar, and Greg Saldutte at Booth's Rustandy Center for Social Sector Innovation and Manal Saleh at the Poverty Lab for excellent assistance on this project and Michael Stepner for comments.

![]()
![]()
![]()