
As football warms to what Moneyball-style stats have done for MLB, Booth alumni and faculty are making an impact.
- By
- January 10, 2016
- Analytics
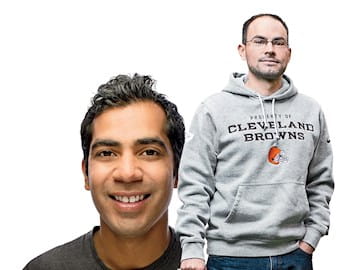
One morning last fall, before the San Francisco 49ers began their second season in a glitzy new $1.3 billion stadium, Moon Javaid, ’12, manager of business operations for the team, took a hard look at concessions. Sure, this is football. Concession sales were going to be strong. But, he asked, could they be stronger?
Javaid, with his background in advanced analytics, turned to hard data for the answer. He scoured sales figures from past seasons. This led him to institute one minor but crucial change to the design of the concession stands: he redirected the queues so that they snake around stanchions, like an airport security line, at 75 points around the stadium. By the midpoint of the season, the move had increased sales by one extra transaction per line per minute since—amounting to an extra $20,000 per game, or $200,000 over the course of each season’s home games, including the preseason.
It might sound like loose change—beer money—for a franchise that collected $427 million in revenue in 2014, the first season in Levi’s Stadium, in the heart of the fans and fortunes of Silicon Valley. Javaid, however, understands that the small improvements add up, and his is a top-five revenue-producing team. “In the NFL, it’s not tremendously difficult to make money,” he said. “You can do B+ work by not really doing much, and you can still be profitable. But in order to get to the next level, you need to find those little wins.”
This season, he and his five-person business ops team found those victories by introducing not only the stanchions but also more beverage-only lines, and by repositioning the retail kiosks, increasing the efficiency of mobile ordering, and pushing the stadium opening time back 30 minutes. That last modification alone, brought about after Javaid’s team noticed that most fans lingered in the parking lots pregame anyway, created what he describes as a “six-figure impact” in what the 49ers saved on staffing.
Though no one’s going to argue that the redirection of a concessions line makes for high Hollywood drama, Javaid is essentially applying Moneyball-style stats to the business of football, with hard data driving industry decisions. “Without data,” he said, “I think it’s really difficult to find those $20k, $40k, $50k opportunities that, when multiplied over the number of events, generate millions of dollars in aggregate to the bottom line. That’s giving our ownership a little more financial flexibility so we can put the best product on the field.”
We’ve all seen the Brad Pitt movie at this point. We know that baseball managers consult computer printouts with statistics and graphs before every decision, and that basketball players can study the pick-and-roll defensive tendencies of every opponent they’ve ever faced at any moment in their careers.
But football hasn’t changed much in the nearly 50 years since the first Super Bowl (1967), and the NFL has seemed lukewarm about embracing analytics. This is, after all, a sport that measures its first downs with the analog precision of a chain-link cord extended between two people on the sidelines. There is not even a clear way to measure the productivity of its most important player. Would that be determined by QBR or passer rating?
Compared with the other major North American sports, football appears to be in its analytics infancy. That makes the sport an appealing enterprise for Booth professors John Huizinga, Kevin M. Murphy, PhD ’06, and Tobias J. Moskowitz—the three men who created Booth’s pioneering Sports Analytics course, now in its third year—and alumni such as Javaid and Ken Kovash, ’06.
Huizinga, who’s Walter David “Bud” Fackler Distinguished Service Professor of Economics, and Murphy, who’s George J. Stigler Distinguished Service Professor of Economics, are offering the course this spring. This time they’re co-teaching it without colleague Moskowitz, Fama Family Professor of Finance, who is on leave.
For the NFL, it turns out, the winning analytics equation is a lot longer than once thought.
“In baseball, every franchise has a team of people devoted to analytics efforts,” said Kovash, VP of player personnel for the Cleveland Browns. “In the NFL, that’s far from the case.” The Browns, in fact, typically don’t make Kovash available for interviews and don’t even use the word “analytics” to describe his work with data. “We talk about it in terms of being progressive,” he said. “Trying to find competitive advantages and trying to have more and better information than the 31 other teams. The opportunity to really contribute to something at its early stages is really, really attractive and exciting.”
The average NFL team is currently worth more than $2 billion. That money, which has approximately doubled since 2011, could be considered an investment in the future of the team, whether it’s used for signing players or coaches, enhancing facilities or equipment, food or trainers, toward future performance. Competitive balance has given the league more parity than ever. Television ratings for week one of the 2015–16 season hit an all-time high.
On a fan level, the rabid success of daily fantasy football (see “Data and Daily Fantasy Football”) confirms an appetite for inventive DIY data crunching even at home and on a 24-hour loop. At the pro level, standing out requires creativity, and more and more it’s the analytics experts in the organization making that happen.
In 2012, Javaid was a member of a Booth student team that beat out 22 other business schools to win the NFL’s first case-study competition, run through the MIT Sloan Sports Analytics Conference. The challenge was to determine how franchises should go about conceiving the “right size” of a new-build stadium, including a methodology for allocating seating arrangements and suites and creating a pricing structure. Javaid’s team fulfilled the brief and then went further, examining why some existing NFL stadiums were not ideally designed to maximize revenue. They reasoned that the Superdome in New Orleans, for instance, would be optimized with 11,000 fewer seats at higher average prices. And they suggested that the Philadelphia Eagles were undervaluing their average ticket prices by $26, inadvertently leaving money on the table.
Javaid said that the project helped him get in the door for an interview with the 49ers, who hired him in March 2013—just as they were designing their own new stadium. That same spring, Moskowitz, Murphy, and Huizinga launched Booth’s first Sports Analytics course. Moskowitz is an award-winning financial economist and a consultant for hedge fund AQR Capital Management. But he is perhaps best known among sports fans for Scorecasting, which he coauthored with sportswriter L. Jon Wertheim. The 2011 book defied conventional sports wisdom through quantitative reasoning. Among Moskowitz’s chief arguments: football teams should not punt the ball on fourth down nearly as often as they do.
His explanation relied on statistics that either nobody had bothered to look for, or nobody had bothered to connect and publish. It seemed reminiscent of the early work of Bill James, the onetime security guard at a Kansas pork-and-beans factory who began publishing annual baseball abstracts in the 1970s, which finally caught the attention of the Oakland A’s general manager, Billy Beane, in the late 1990s, and whose story became the basis for Moneyball. More than a decade later, baseball games are now atomized behind the scenes beyond a point of recognition. Every pitch, at any level, can produce dozens of metrics for teams of stat gurus to ingest.
“Among Moskowitz’s chief arguments: football teams should not punt the ball on fourth down nearly as often as they do.”
—
In fact, according to Vince Gennaro, ’77, president of the Society for American Baseball Research and a consultant to MLB teams, “Today we are capturing one terabyte of data per game.” It is the hypothetical equivalent of 800 centuries’ worth of baseball data generated each time two Major League Baseball teams now take the field.
Consider this: there were about 190,000 games played between 1870, the first year of professional baseball, and 2005. Every bit of information recorded on the field of play during those games could theoretically be loaded onto a 1.5-gigabyte drive. A single terabyte—the information from a single modern-day MLB game—is 666 times larger than that.
It’s a mind-numbing amount of information, as well as the reason every sport in the analytics game is now trying to catch up to baseball, the unlikely early adopter. Yes, America’s pastime, the sport that leans so heavily on tradition and wistfulness, and that still requires managers to wear uniforms and make calls to the bullpen with landline phones, is far ahead in the big-data revolution.
Compared with football, before and after the era of digital documentation, baseball has always at heart been a more analytics-driven game. Baseball has more static action, more one-on-one interactions, and a stronger historical connection to statistics. (Most baseball fans could name Hank Aaron’s home-run record, or the year Ted Williams batted .406. But can football fans say what the career passing touchdown record is? Or who holds the record for rushing yards in a season?) In football there are more moving parts, more interactions among multiple players, and only 16 games to the regular season, compared with 162 in baseball. All of these factors limit the amount of data that’s generated.
These particulars of the game also create unlimited possibilities for Booth to be part of football’s analytics future. The ubiquitous transformation of baseball into an analytics-driven game is a testament to the larger power of data in its every application. It presents the challenge of figuring out how best to apply the unprecedented access to information today without eclipsing the ultimately unquantifiable, unpredictable aspects of sports that have captivated us for decades—and make it about the only category of entertainment that still demands real-time TV.
“Analytics should be used with everything else at your disposal,” Moskowitz said. “Ignoring it is probably a bad idea. Putting all of your faith in it is equally bad.”
In 2006, Mike Girsch, ’03, left a job doing valuations with Boston Consulting Group to start at the very bottom of the baseball front-office hierarchy: with an entry-level position in the scouting department with the St. Louis Cardinals. At the time, it was the only way into a sport that was beginning to hire mathematics majors like him. Girsch recalled watching manager Tony La Russa and pitching coach Dave Duncan use colored pencils to create their own handcrafted spray charts after every game.

“Now every ball ever hit by any player anywhere, in the minors or majors, is tracked seven ways to Sunday,” said Girsch, today the team’s assistant general manager, with World Series rings from 2006 and 2011. “I think as an industry we’ve done a pretty good job squeezing the majority of what’s going to be squeezed out of that sort of analysis.”
Let’s just say that colored pencils aren’t necessary anymore. Statcast, the terabyte-per-game camera capture system set up by MLB in each of its stadiums last season, has blown all previous statistics-generating operations out of the water. Every MLB franchise has a team of five or six people like Girsch hunting down the numbers behind what’s left. “Whatever you call old school today is unrecognizable from what old school was 10 years ago,” he said. “It’s changing fast.”
Football too moves forward, albeit at its own pace. A decade ago, Kovash, newly graduated from Booth, was determined to work in his favorite sport. But football teams weren’t interested. He essentially had to launch his own venture just to get the attention of the NFL—to demonstrate that analytics have a place in the game.
He began a project with University of Chicago’s Steven Levitt (coauthor of Freakonomics) that applied economic game theory to play calling in the NFL as a way to assess coaches’ decision making. He traced data back five years and found a trove of interesting patterns. “The whole goal of that was to get me a job with a team,” Kovash said. “That process took a lot longer than I ideally hoped.”
Despite Kovash’s initiative and enthusiasm, NFL teams still seemed resistant to hiring a guy with a background in finance, economics, and marketing, but not in scouting. Kovash then went to San Francisco to do analytics work for Mozilla, the software giant. Finally, in 2010, the Dallas Cowboys called. They wanted him to come build one of the league’s first analytics departments.
Kovash was elated. Then reality hit him.
“It was essentially like starting from scratch,” he said. Much of the first few months simply entailed convincing coaches and scouts that his role was necessary. His tasks were not especially intensive. The ways teams quantified the values of players or assessed game situations had not changed much in decades. Much of Kovash’s job entailed “sitting down with [then] head coach Wade Phillips, or spending a million hours with the scouts and just learning a lot and understanding, ‘OK, does information exist in the world that can help answer these questions?’” Often it does, but somebody like Kovash needed to know where to look. “You can’t gain the competitive advantages you are seeking unless you collaborate with the coaches and scouts that have the football expertise to help you find the questions and the answers.”
“They looked at me like I had four heads. One of them asked, ‘Is that a Star Trek convention?’ Those guys are all in investment banks and hedge funds. I think this same group of people, if we went back to Booth now, we might all be trying to get into sports.”
— Michael Girsch
Today, the avalanche of data hurtling toward the analysts of every team in athletics after each and every game creates an altogether different challenge. What Statcast now delivers in baseball, SportVU does in all NBA games and in various soccer arenas, capturing the movement of every player in action—25 times per second—and producing instantaneous data on quickness, leaping ability, and so on.
“We’ve gone from a menu that had a few things on it to an all-you-can-eat buffet that fills 20 rooms,” Gennaro said. “We’re at a point now that the big win is in filtering out the data that’s not high impact. Because there are things that are interesting, things that capture a fan’s attention, but perhaps they’re not meaningful or sustainable. They just represent a moment of time that isn’t really that revealing when you’re making an investment decision in a player.”
Accordingly, Michael Gries, ’13, a baseball systems developer for the San Francisco Giants, said that the key to sports analytics lies in figuring out what value the statistics actually provide: “It’s hard to tell what matters and what doesn’t.” For instance, now available to him are about 20 data points on every pitch thrown by every pitcher in every game. That data includes previously unquantifiable statistics, such as the spin rate on a curveball. He can then compare the metrics of a Minor League Double-A prospect’s curveball to that of, say, ace Madison Bumgarner’s, to determine whether or not that prospect deserves to be promoted.
This sounds like it takes out the guesswork, but it only opens up more room for interpretation. “There’s so much data,” Gries said. “We can tell if a pitcher releases his curveball four inches higher than he releases his fastball. But does that matter?”
That’s precisely the kind of question that the Booth Sports Analytics course is equipping the next generation of NFL and MLB data experts to answer. By teaching the same advanced analytical techniques used by professional insiders, including programs like R, MATLAB, and SAS, as well as SQL databases, the course provides students with the experience to step right into a sports franchise and help in crunching those terabytes down into digestible pieces.
“All of the students here are smart, analytically trained, and have the tools,” Moskowitz said. “They have also worked with the kinds of things that real teams work with.”
The sports world has noticed. When Jon Hay, ’13, dreamed of working in baseball and, right out of Booth, landed an interview with the Boston Red Sox, his coursework paid off. Hay mentioned that because of the course at Booth, he was well familiarized with PITCHf/x, a tracking system that analyzes MLB pitchers at a granular level. “Our homework was to take the PITCHf/x data from last year and build a model that predicts pitch location,” Hay said he’d told Red Sox senior baseball analyst Tom Tippett and director of major league operations Zach Scott. “It couldn’t have dovetailed any better.” Hay got the job, working on projects for Bill James, the team’s senior advisor of baseball operations and the father of modern sports analytics. Hay now manages ticketing analytics, one of the many iterations of those initial Moneyball techniques.
Moskowitz said that typically on the first day of Sports Analytics about 90 students show up. The number winnows down to around 45, after the first lecture on logistic regression. (This is not an easy class for sports fans, he warns.)
Be it 90 or even 45 students with an interest in sports analytics, this is still dozens more than when Girsch was a student. He recalled an early 2000s forum that Baseball Prospectus, one of the first data websites, held in Chicago for anyone wanting to hear more about advanced metrics. Girsch tried to gather a few friends to come with him. “They looked at me like I had four heads,” he said. “One of them asked, ‘Is that a Star Trek convention?’ Those guys are all in investment banks and hedge funds. I think this same group of people, if we went back to Booth now, we might all be trying to get into sports.”
“Technology captures previously unquantifiable statistics, such as the spin rate on a curveball.”
—
For baseball, the Moneyball Oakland A’s in the early 2000s surely changed a lot of future career paths. Football, according to Kovash, has yet to experience that breakthrough moment when a team receives mainstream acclaim for its success due to analytics. Intriguingly, that doesn’t mean the analytics aren’t happening behind closed doors.
Huizinga, who co-teaches Sports Analytics and was an agent for NBA star Yao Ming, said that NFL teams might just tend to be more secretive about their techniques than franchises in other sports. “And they’d prefer to keep it that way,” he said. “I watched a bit of Monday Night Football, and there was a great graphic about how the New England Patriots have not used a first-round draft pick in a skill position in a really long time.” It is telling information that suggests perhaps New England had figured out how to best allocate its resources in the draft. The Patriots, after all, won the 2015 Super Bowl, started this season 10–0, and possess one of the top-scoring offenses in the league, even without a star-studded offensive roster.
The Patriots, it should also be noted, have a reputation for being ahead of the curve. Since 2000 they have employed a man named Ernie Adams as “director of football research,” well before other teams started connecting “football” and “research.” New England has won four Super Bowl titles with Adams.
In February 2015, ESPN the Magazine published an article that ranked the analytics efforts of 122 US professional teams across four sports: football, baseball, basketball, and hockey. Four NFL teams landed among the bottom 10 overall. Not a single NFL franchise was “all-in” with analytics, ESPN noted, compared with nine MLB teams, four NBA teams, and even one NHL team (the Chicago Blackhawks). Kovash’s Browns and Javaid’s 49ers were ranked among the NFL’s so-called “believers”—the most-progressive nine teams whom ESPN defines as showing some interest in using analytics.
Where analytics might start to get uniquely interesting for football is with the rapid development of new technology, such as wearable GPS trackers and body-monitoring systems that could potentially relay information about, say, a field-goal kicker’s heart rate from 40 yards out versus 50 yards out, helping teams evaluate which player might have the calmest demeanor, in order to prevail. Such data-generating tech is poised to redefine scouting—and the game—in the same way that Beane did in Oakland when he valued statistics such as on-base percentage rather than batting average. Already, NFL scouting combines a focus on players’ biometric numbers (height, weight, hand size, wingspan) with their on-field stats. The data stands to get even more personalized, more precise, and more predictive.
And naturally, there is extensive interest in medical analytics. The team that can determine which players might be most susceptible to which injuries, and why—and work toward protecting them—would have an enormous advantage in a contact sport like football. Moskowitz said he’s eager to put his students to work analyzing the numbers. “Right now I think everyone is keeping that information very close to the vest.” If data can be applied to supporting the health and safety of players, it has potential to bring about monumental change across sports.
To find the most-transparent, most-immediate returns on analytics in football right now, however, we again might have to turn our attention toward beer. That’s just fine by Javaid, who’s enormously proud of the 49ers’ business standing. “I want to be coming up with innovative ideas so that we can remain one of the best-running organizations in the industry,” he said. “We only have 10 home games, versus 81 for the MLB or 44 for the NBA. We’ve sold out our tickets, so that allows our team to focus more attention on these ideas.” Changing the way things are done takes some creativity, he added. “And that’s where I like to live.”
MILESTONES IN TRACKING DATA TO HELP IMPROVE YOUR HEALTH

Abraham-Louis Perrelet's
Pedometer
The Swiss horologist is credited with making the first pedometer, basing his 1770 invention on his mechanism that powered a self-winding watch.

Polar Loop Tunturi
Pulser
This battery-powered fingertip heart-rate monitor is Polar's first retail device. The company goes on to become a leading maker of portable heart monitoring trackers.

Garmin
Forerunner 201
The 201's GPS sensor measures pace, distance, calories burned, and even the steepness of a slope the wearer is climbing. The 201 is Garmin's first device that can pair with personal computer program to track activity.

BodyMedia
GoWear fit
BodyMedia's first direct-to-consumer calorie counter and pedometer also measures sleep duration and efficiency.
FitBit
Tracker
FitBit makes a splash at TechCrunch50, prompting the New York Times to report: "Using the Fitbit Tracker is like having a personal trainer, nutritionist and sleep doctor attached to your hip at all times."

Nike+iPod
fitness tracking
Nike creates a shoe whose insole has a grape-size hole that can be filled with a Nike-branded Bluetooth transmitter. It connects to Apple iPod software that tracks fitness activity and allows the user to share the data on the web.

Jawbone
UP
Known for Bluetooth headsets, Jawbone debuts a wrist-worn fitness tracker that works with iOS devices. UP doesn't fly initially, and Jawbone reintroduces it a year later.

Pebble
Pebble Technology's crowdfunding campaign for a wrist-worn fitness tracker raises $10.3 million in pledges from 69,000 backers.

Google Glass
Google's computer with heads-up display inspires apps such as Strava, which project your stats into your field of vision. (No more looking down at your phone or wristband.)

Apple Watch
The tech behemoth launches its own activity tracker and interest skyrockets. Market researcher Canalys estimates nearly 7 million units shipped in the first two quarters of availability.
We'd love to hear your Booth memories, stories, connections...everything.