How the Treasury Yield Curve Reflects Worry
- By
- April 08, 2020
- CBR - Finance
In normal times, when the market is relatively calm, the US Treasury yield curve tends to slope upward, reflecting that investors expect to be paid more when lending over the long run. In times of crisis, the curve usually flattens out or slopes downward, which is traditionally considered an indication that a recession is coming.
But when the US stock markets went into crisis mode in March, the yield curve didn’t always move in this usual pattern. That’s a worrying sign, according to Chicago Booth’s Zhiguo He and Johns Hopkins’s Zhaogang Song.
Investors’ flight to cash
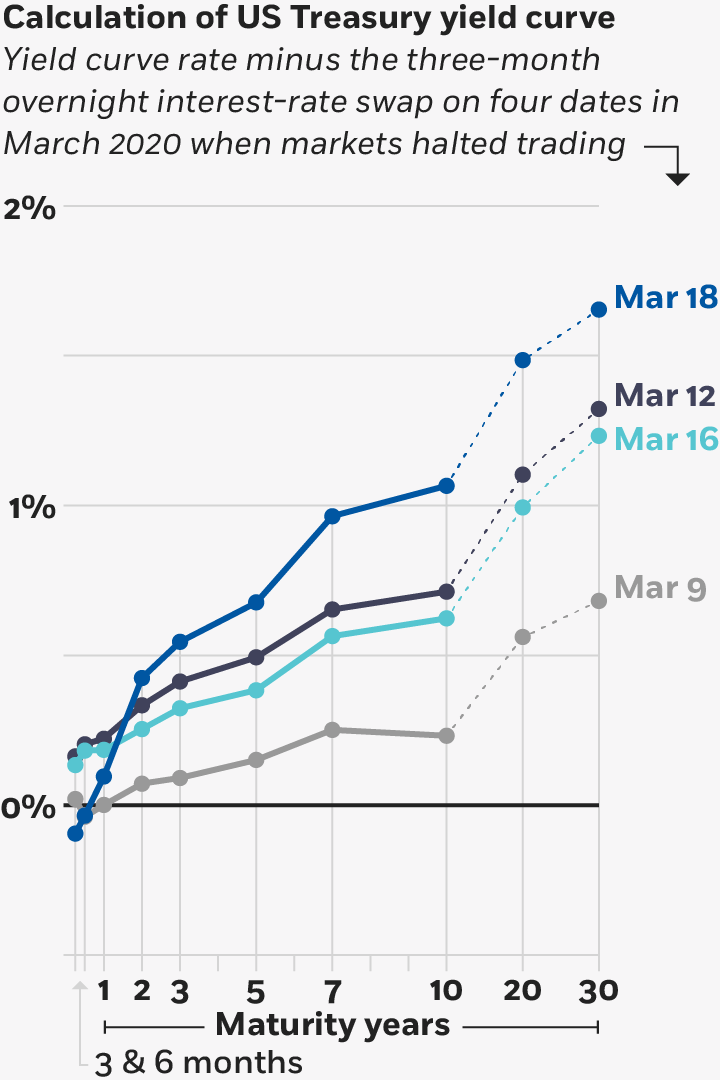
On a series of days when the US stock market collapse triggered temporary halts in trading, investors initially moved into long-term bonds, pushing their yields down. But on subsequent days, they turned to short-term T-bills, and the overall yield curve steepened.
He and Song, 2020
The researchers looked at what happened during two weeks in March when the US stock market hit an unprecedented number of market-wide circuit breakers, which kick in and temporarily halt trading during periods of dramatic market drops. Market declines that cross thresholds of 7 percent, 13 percent, or 20 percent, calculated on the basis of the prior day’s closing price of the S&P 500, can trigger trading halts ranging from 15 minutes up to the rest of the day, all depending on the time.
On March 9, when a circuit breaker triggered the first market-wide halt in stocks, the curve reflected a typical flight to safety. Amid panic, investors dumped stocks and moved into long-term bonds, pushing the price of bonds up and their yields down. The yield curve flattened.
But during the second and third market-wide halts of stocks, on March 12 and March 16, the yield curve changed, the researchers note. As a liquidity crisis loomed, it appeared that investors started to worry about the safety of long-term bonds, so they sold those and scrambled for cash-like instruments. Short-term T-bills, which can be quickly converted to cash, became highly favored by investors, raising T-bills’ prices relative to long-term Treasurys and making the entire yield curve slope upward again—despite efforts from the Federal Reserve to calm the markets by buying long-term bonds.
On March 18, when the stock market halted for the fourth time in this sequence, the slope of the yield curve steepened further, indicating a dire situation. The upward slope was driven by a surging demand for cash—US currency, in particular. Not knowing how long it would take for normal business to resume from the looming crisis, investors—including companies, banks, and sovereigns— stocked up on cash that they could use to settle contracts or pay off debts.
Zhiguo He and Zhaogang Song, “Tracking the Yield Curve,” March 2020.
Your Privacy
We want to demonstrate our commitment to your privacy. Please review Chicago Booth's privacy notice, which provides information explaining how and why we collect particular information when you visit our website.