No One Has All the Answers for COVID-19 Policy
The trade-offs are evident, but the costs involved are ambiguous.
- By
- May 04, 2020
- CBR - Public Policy
The COVID-19 epidemic and the policy response to it have already become a wellspring for new economic research, and economics will no doubt emerge from this unprecedented global moment with new evidence for important macroeconomic phenomena. But however the crisis informs economics, it has also reaffirmed one of the science’s core tenets: important decisions involve trade-offs.
The notion of trade-offs, or the idea that there is an opportunity cost to any choice, is central to much of economics. The study of these trade-offs is often associated with traded quantities (the dollar value of things such as domestic production, interest rates, workers’ salaries, etc.), but the COVID-19 pandemic places economists in the uncomfortable position of examining things such as the economic value of human life, the quality of such lives, and the human stresses related to attending to a pandemic. Despite the natural discomfort most people (many economists included) feel about quantifying these things, these economic exercises still play an important role in our understanding of the situation and our crafting policy to address it.
Consider this illustration highlighting the trade-offs inherent in the current pandemic:
Trade-off between the COVID-19 quarantine and the costs of the economic slowdown
 >
>
Pagliari, 2020
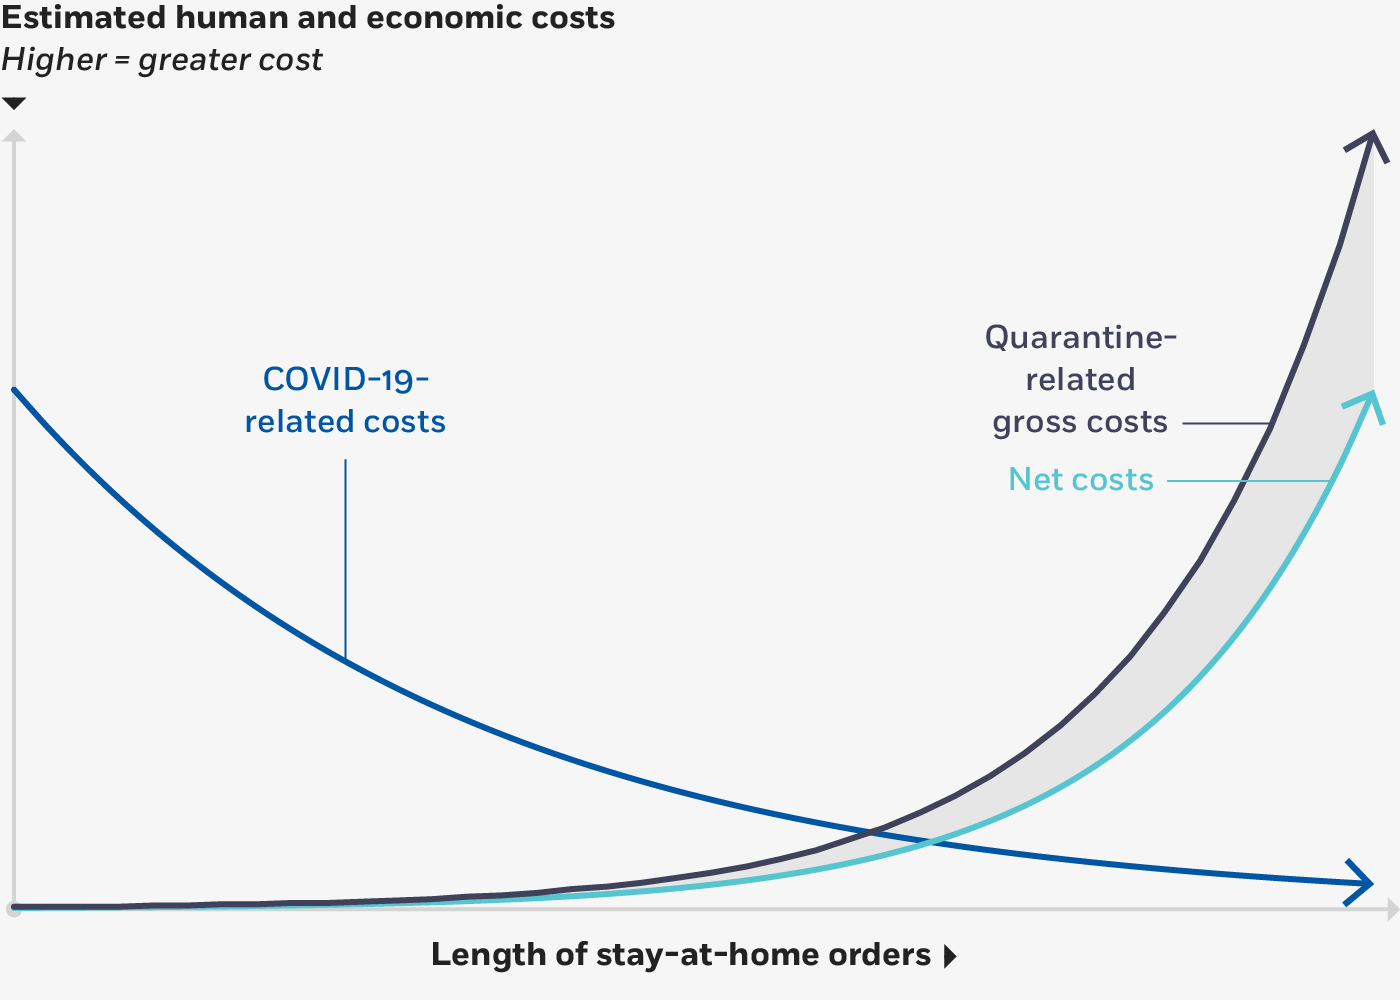
As has been much discussed elsewhere, the intention of the stay-at-home (or shelter-in-place) measures in effect throughout the United States is to “flatten the [epidemiological] curve,” or to slow the rate at which the virus spreads, thereby reducing the likelihood of a surge in demand for medical services that leads to sorrowful, triage-like decisions about whom to treat. The “COVID-19-related costs” curve illustrates the all-in costs of mitigating the adverse effects of the coronavirus as a function of the length of the government’s quarantine measures. These all-in costs include not only those who unfortunately perish due to the virus, but also the economic and human costs of providing these medical services, including the extraordinary efforts of the medical community in responding to the pandemic. To state the obvious, these costs are exceedingly difficult to quantify.
The “quarantine-related gross costs” curve illustrates the all-in gross costs relating to the slowdown in the country’s economic production, while the adjacent curve illustrates the net costs, after having considered various fiscal and monetary policies designed to mitigate those costs. Both of these curves are also functions of the length of the government’s quarantine measures.
The steep curvature is meant to illustrate that a throttled economy eventually reaches a cascade of compounding adverse effects. As one of innumerable examples, consider that many retailers can now pay neither their employees nor their rent (as well as a score of other charges); in turn, their workers’ anxiety about if and when they will be reemployed leads them to curtail their consumption, and this lowered consumption adversely ripples through the economy. Similarly, the unpaid rent leads to the landlords’ inability to service the mortgage, and these defaults also adversely ripple through the economy, and so on and so on.
While the initial interpretation of the gross- and net-cost curves may be that they simply represent a portion of the country’s forsaken GDP, the more compassionate interpretation is that this productivity also acts as a proxy for the quality of human life. Economic tragedies (lost employment, business bankruptcies, depleted life savings) often bring about human tragedies (alcoholism, drug addiction, family dysfunction), which sometimes culminate in the loss of life. Moreover, the stay-at-home measures disproportionally affect lower-than-average wage earners, and so, hit hardest are those who can least afford it.
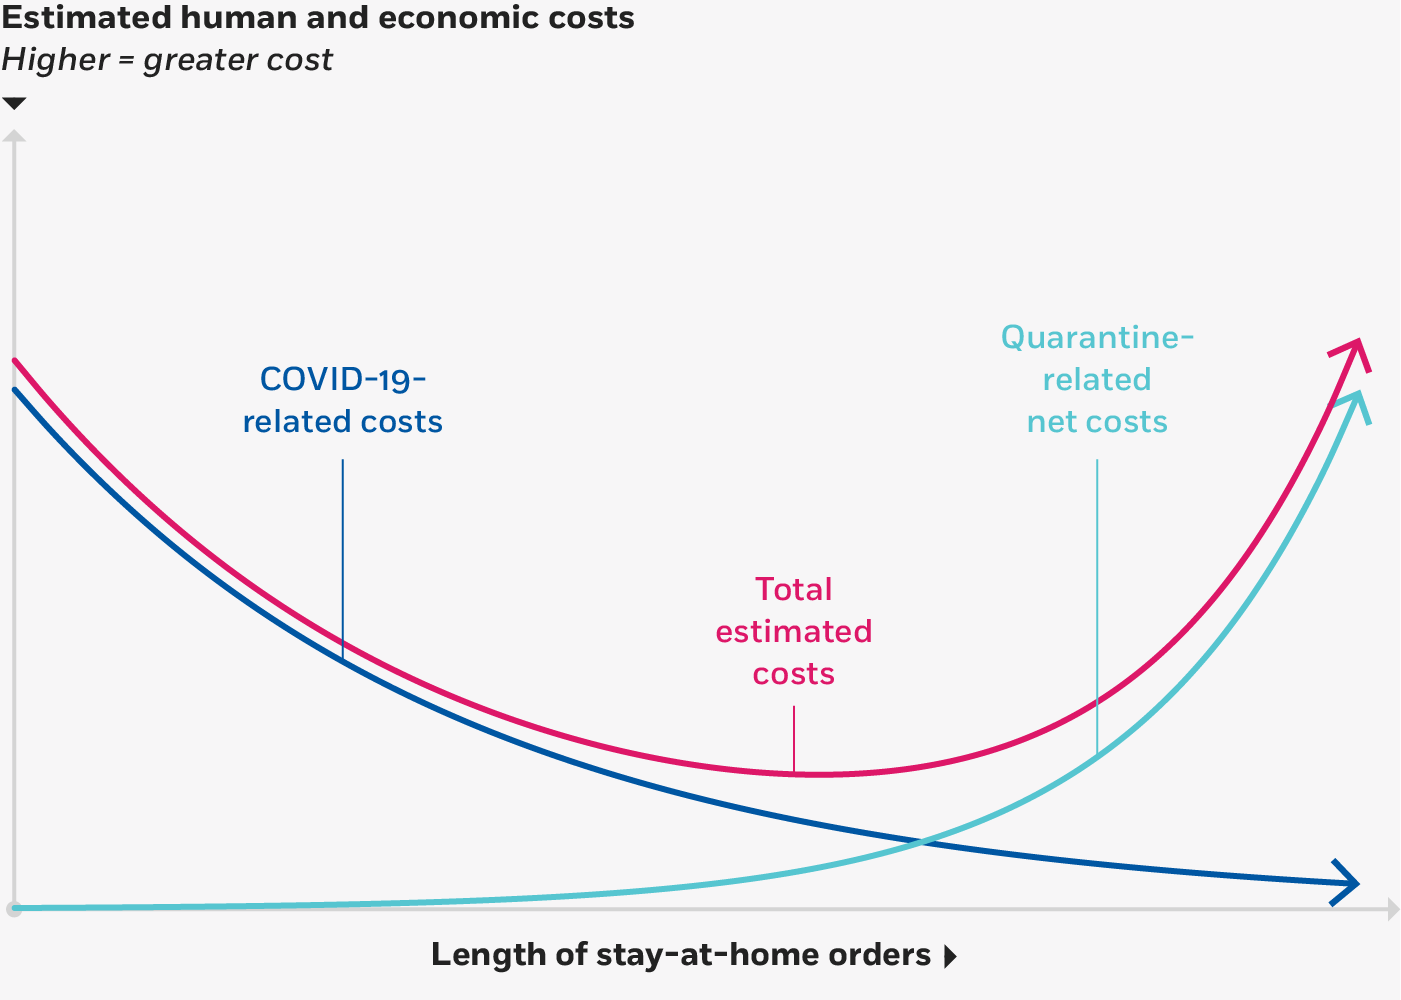
Consequently, fair-minded policy makers (and those who advise them) try to strike a balance between these two competing forces, as illustrated here by the “total estimated costs” curve, which represents the sum of the two costs:
In search of a balance between two competing forces
Pagliari, 2020
The trough of the total-costs curve theoretically represents the length at which stay-at-home measures optimally trade off one cost against the other.
These two graphs have been drawn without a scale. That’s because it is difficult to calibrate such a model. Yet, that is the awkward and unenviable task our policy makers face. Reasonable people will disagree on the parameterization of such analyses and, given the life-and-death nature of such decisions, it is unsurprising that such disagreements invoke strong reactions.
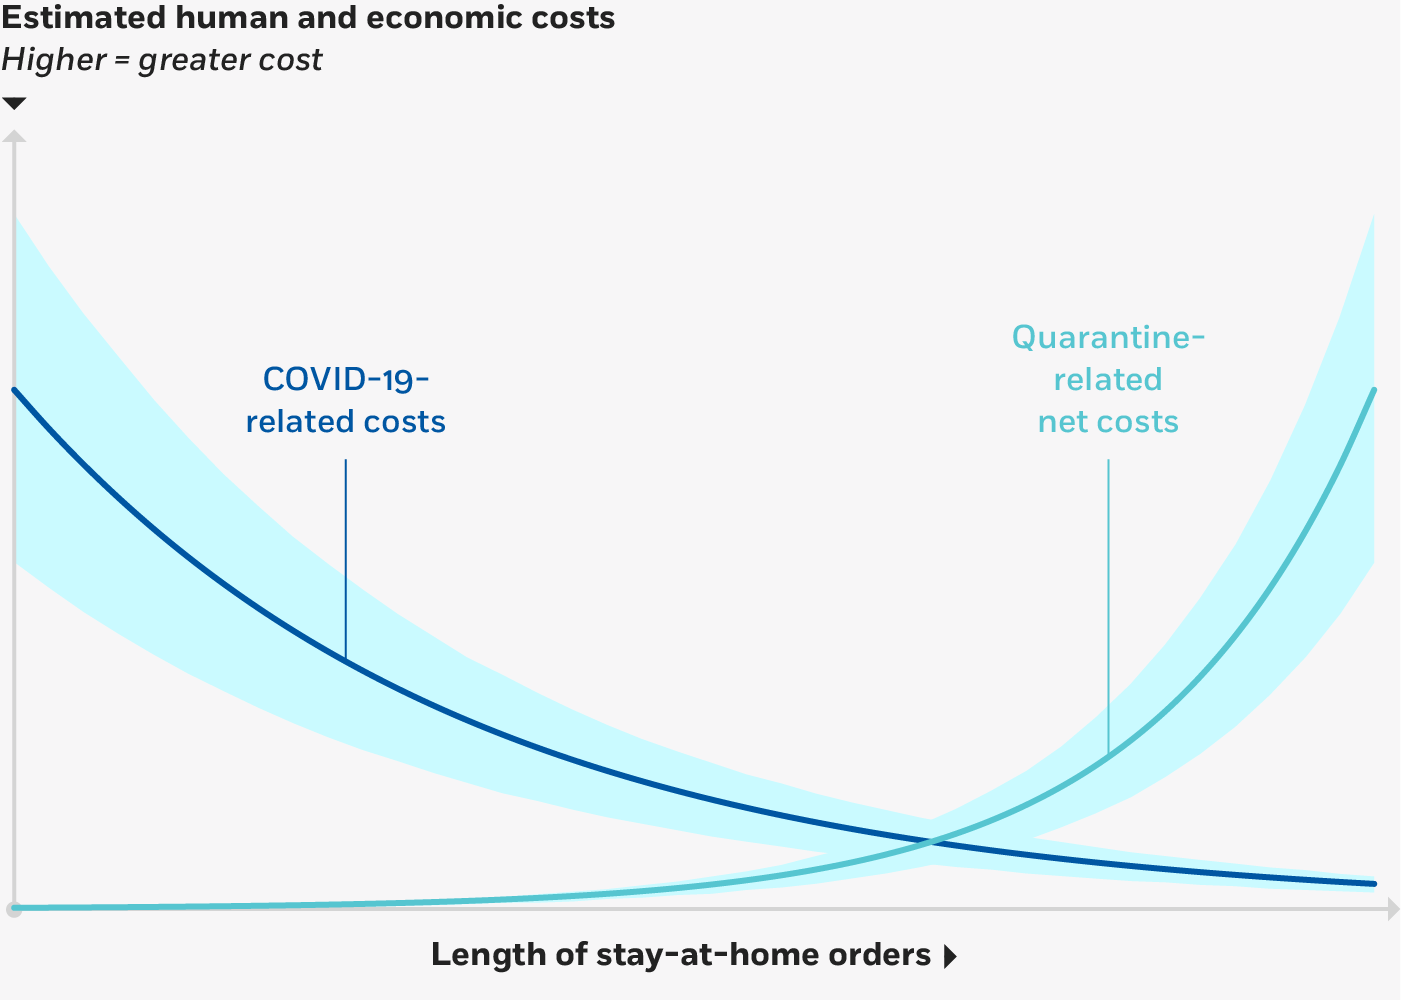
Given the difficulty of assigning actual values to the critical points on these curves, it would seem that a little humility is in order. There is much that is unknown—data about the virus’s rate of infection and its mortality rate, for instance, are still arriving from various sources, and it’s unclear how easily data from one locale can be generalized to others—and a clinical consensus has yet to be reached on many of the virus’s key lethal characteristics. Something similar could be said about the uncertainty surrounding the economic effects of an abrupt curtailment of production; the US has experienced relatively few such events. As a result, we would be better served by recognizing that even our best estimates are merely projections set among a wide range of potential and plausible outcomes:
Room for some uncertainty
Pagliari, 2020
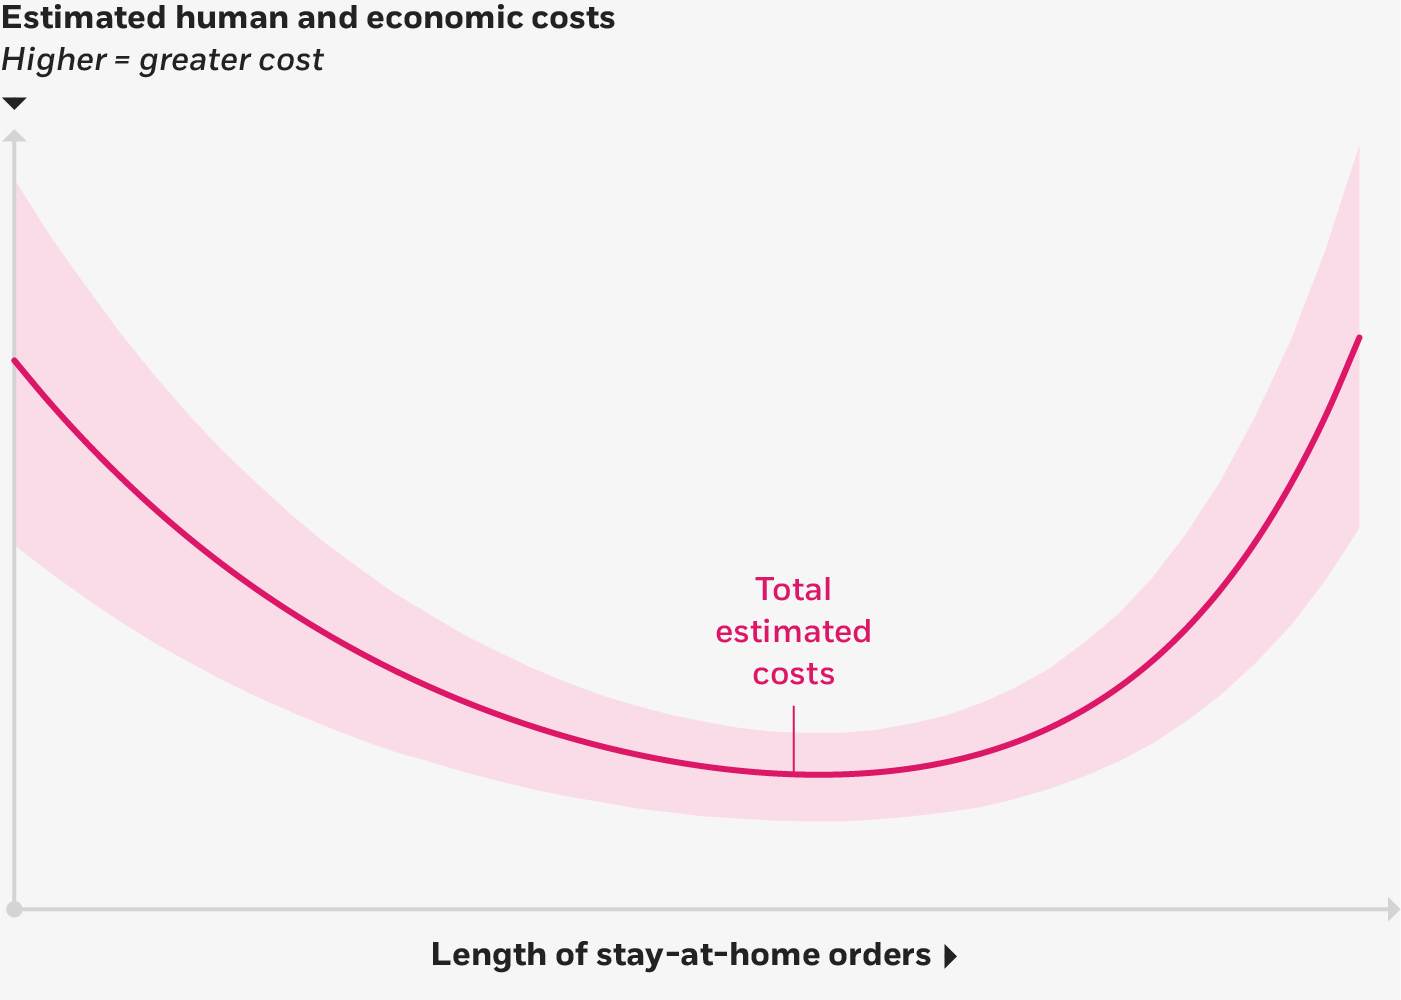
In the figure here, the shaded regions represent the uncertainty in calibrating the model. But here, too, the illustration implies unjustified certainty. There’s always the risk that our confidence intervals are too narrow and that conditions will change over time. For instance, our analysis here is complicated by a host of factors, including:
- the possibility of finding a pharmaceutical cure
- the uneven lifting of stay-at-home orders, with certain geographies and/or sections of the population returning to work sooner than others
- the possibility of the virus reemerging after initially being knocked down
- the ever-present problem of “unknown unknowns,” or the factors about which we don’t even recognize our own ignorance
All of these contribute to yet another confidence band, around the estimate of the optimal stay-at-home measure:
Further uncertainty around the optimal stay-at-home measure
Pagliari, 2020
As University of Chicago’s and Chicago Booth’s Lars Peter Hansen has observed, “Prudent and smart decisions don’t require full knowledge. They require that you assess the uncertainty and figure out its potential consequences.”
Economics provides a useful lens through which we can evaluate competing options, even if they are all “bad” options. The practice of examining trade-offs and searching for the optimal outcome(s) can serve us well in the current crisis. But we must all acknowledge the uncertainty inherent in our analyses, and accept that we will not have full knowledge of all the variables involved for quite a long time, if ever.
Joseph L. Pagliari, Jr. is clinical professor of real estate at Chicago Booth.
Your Privacy
We want to demonstrate our commitment to your privacy. Please review Chicago Booth's privacy notice, which provides information explaining how and why we collect particular information when you visit our website.