How New York City Could Reopen Its Economy, Neighborhood by Neighborhood
- July 13, 2020
- CBR - Public Policy
Exploring ways that local urban planners could manage quarantines and economic shutdowns in spatial and geographic terms, a team of researchers developed a model with the goal of finding a way to bring down overall infection rates at the lowest possible economic cost. Using New York City as an example, Chicago Booth’s John R. Birge and Ozan Candogan and Northwestern PhD candidate Yiding Feng find that some urban neighborhoods and public spaces may serve as hotspots for disease transmission and should be targeted for closure—but elsewhere, certain hubs of vital economic activity could remain open. (Read more about the research.)
Neighborhood by neighborhood, rather than citywide
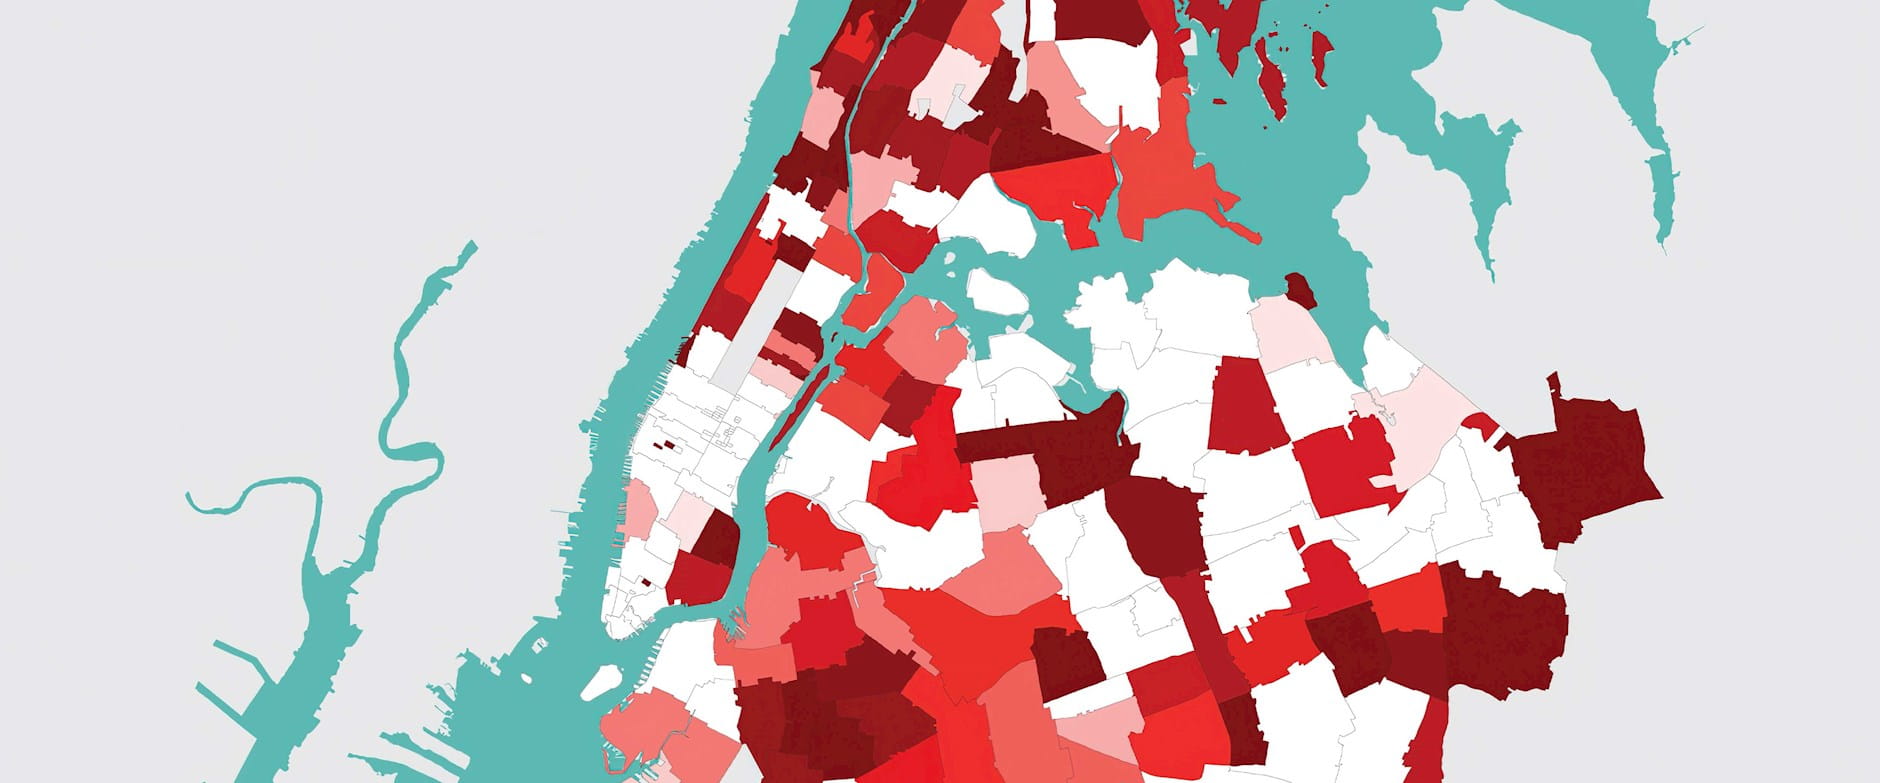
These interactive maps illustrate a range of scenarios in which leaders could open up economic activity in certain zip codes across New York while fully or partially shutting down others.
How to set the level of economic activity in each New York neighborhood
The researchers identified to what extent every zip code would have to remain locked down in order to maximize economic output in Midtown and other key areas while minimizing further infections (assuming 0% economic activity in nearby counties outside New York City).
Economic activity following a policy of reducing infections uniformly in neighborhoods citywide . . .

^ Measure of policy’s efficiency: 48.8% ^
. . . and following a policy of preventing a second wave of infections once the spread is contained
^ Measure of policy’s efficiency: 93% ^
Birge et al., 2020
How to account for what happens beyond the city limits?
Effectively targeting urban neighborhoods would depend on coordination with other local and state governments. New York City doesn’t exist in isolation, so a refusal to halt activity by counties in New Jersey, for example, could undo even the best-laid plan for Manhattan.
Implications if neighboring counties were less cooperative
While the calculations for the maps above assume neighboring counties in New Jersey and elsewhere keep their economies fully locked down, the following maps report the results if those counties’ economies operate at 80 percent of their normal levels.
Economic activity following a policy of reducing infections uniformly in neighborhoods citywide . . .
^ Measure of policy’s efficiency: 40% ^
. . . and following a policy of preventing a second wave of infections once the spread is contained
^ Measure of policy’s efficiency: 87.4% ^
Birge et al., 2020
John R. Birge, Ozan Candogan, and Yiding Feng, “Controlling Epidemic Spread: Reducing Economic Losses with Targeted Closures,” Working paper, May 2020.
Your Privacy
We want to demonstrate our commitment to your privacy. Please review Chicago Booth's privacy notice, which provides information explaining how and why we collect particular information when you visit our website.