
It’s possible to use real-time market odds data for soccer matches to determine probabilities for various margins of victory.
- By
- October 31, 2016
- CBR - Economics
It’s possible to use real-time market odds data for soccer matches to determine probabilities for various margins of victory.
Betting on sports is big business worldwide: betting expert Patrick Jay, speaking to the United Nations, estimated the global sports-gambling industry to be worth between $1 trillion and $3 trillion in 2015. And new technologies are helping bettors find new ways of placing their wagers: around the world, online bookmakers are able to offer their clients real-time betting markets with continuously updated odds that facilitate betting throughout the duration of matches.
The odds for the outcome of a sporting match change in response to events within the match. As a result, research indicates, it is possible to use betting-market information to predict game outcomes. Chicago Booth’s Nicholas Polson, Chicago Booth PhD candidate Guanhao Feng, and University of Chicago graduate student Jianeng Xu examined the betting market for soccer matches in the English Premier League (EPL) and find that it’s possible to use real-time market odds data to determine probabilities for various margins of victory.
The researchers’ model relies on the market efficiency of the betting-odds market for its predictive power. It begins by calibrating two opposing teams’ average levels of strength and expected scoring rates by using the initial odds set for a win, loss, or draw. It then uses odds data updated throughout the match to calculate, as the match progresses, the probabilities of various final score differences. The model makes it possible to follow the implied volatility of the outcome throughout the match and demonstrates how the market forecast adapts to game events.
An underdog’s chances change by the minute
As each significant event took place during a March 5, 2016, match between Everton and West Ham of the English Premier League, betting markets reacted, quickly adjusting each team’s chance of winning.
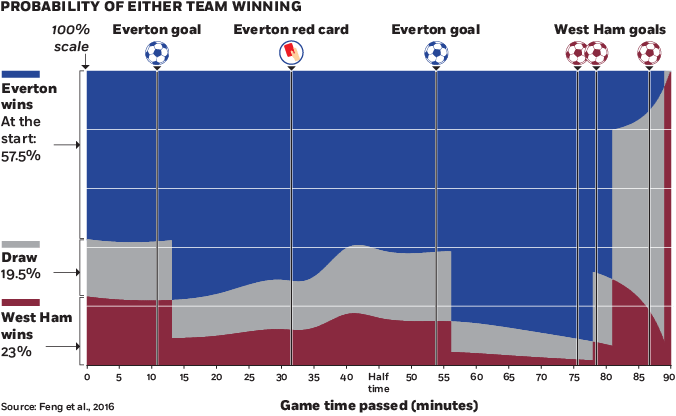
The researchers illustrate their findings with betting data for a March 2016 match between Everton and West Ham of the EPL. The market-implied probabilities for three different outcomes—a West Ham win, an Everton win, or a draw—vary throughout the game in response to major match events, such as goals or red-card penalties.
The model measures the effect of game events on the market probabilities of different outcomes. The researchers find the model fits the dynamics of the EPL within a game, but they note that it can also be applied to other sports, such as baseball and hockey.
Guanhao Feng, Nicholas Polson, and Jianeng Xu, “The Market for English Premier League (EPL) Odds,” Working paper, July 2016.
Your Privacy
We want to demonstrate our commitment to your privacy. Please review Chicago Booth's privacy notice, which provides information explaining how and why we collect particular information when you visit our website.