Infographic: How Inflation Is Different Online
- November 05, 2018
- CBR - Economics
With the share of spending going to e-commerce almost tripling in the past decade, Chicago Booth’s Austan D. Goolsbee and Stanford’s Peter J. Klenow wondered how inflation in online sales compares to inflation in overall sales, and how new products might change the results. The accepted way of measuring inflation is with the Consumer Price Index, which is released monthly by the US Bureau of Labor Statistics. The CPI reflects the prices urban consumers pay for a basket of goods and services—including household products, recreational items, and other categories—mostly in traditional (as opposed to e-commerce) transactions.
The researchers created a new measure they call the Digital Price Index, based on data from millions of online transactions gathered by Adobe Analytics. Used by 80 percent of Fortune 500 retailers, the Adobe data represent about 15 percent of all retail e-commerce tabulated by the US Census Bureau. The researchers built the index to match as many CPI categories as possible, and they find lower inflation than the CPI almost entirely across the board. “If online pricing is fundamentally different than traditional retail, its spread could have a rising impact on the overall Consumer Price Index and, potentially, bias it,” the researchers write.
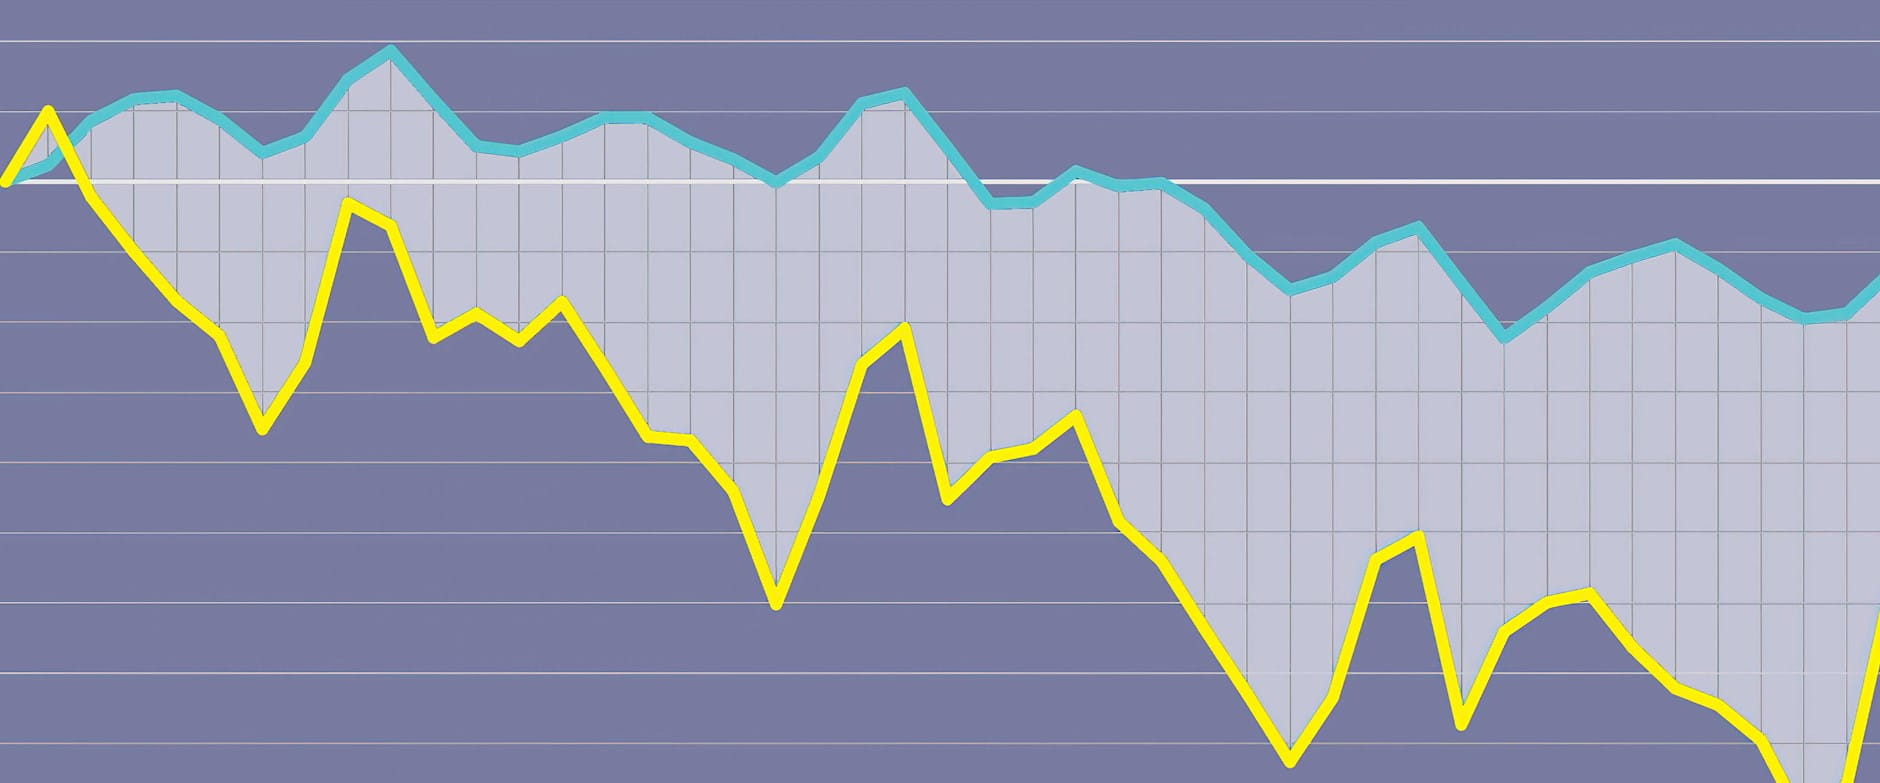
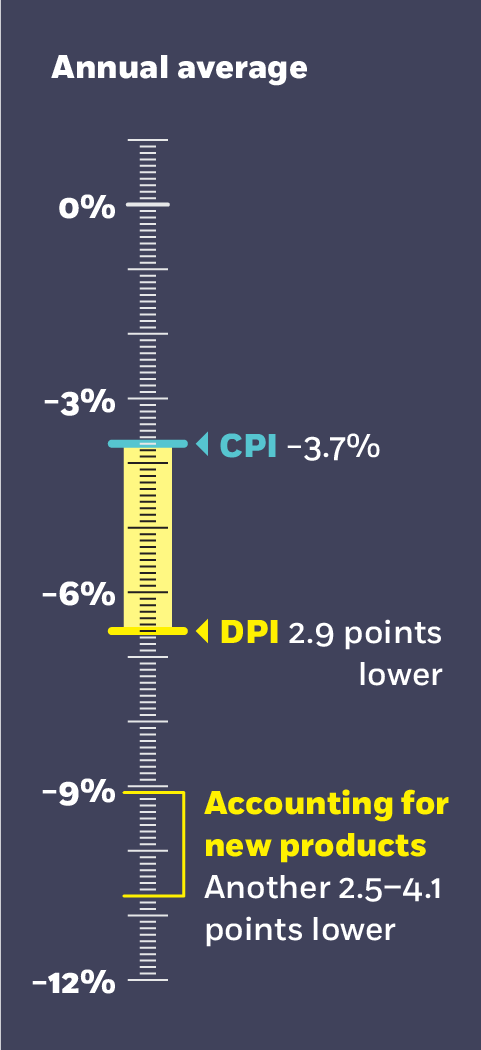
Digital Price Index vs. Consumer Price Index
Consumer Price Index: The US Bureau of Labor Statistics’ measure mostly tracks traditional spending rather than e-commerce.
Digital Price Index: Creating an e-commerce counterpart to the Consumer Price Index, the researchers find that between 2014 and 2017, inflation for online goods was at least 1 full percentage point lower every year than inflation for equivalent goods in the CPI.
Household-goods category
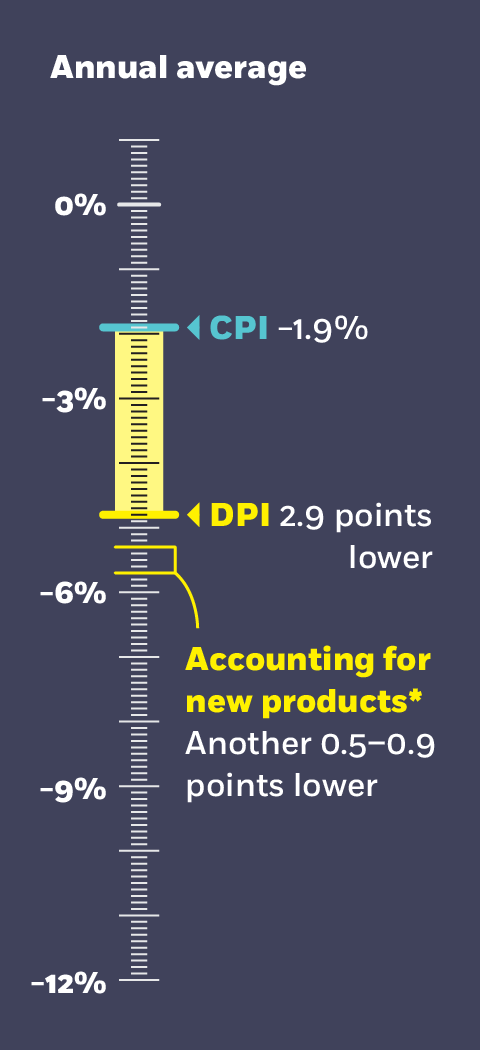

*Further decrease in DPI inflation: The researchers find that when they factored in new products entering the market and others dropping out, online inflation decreased by another 1.5–2.5 percentage points per year overall.
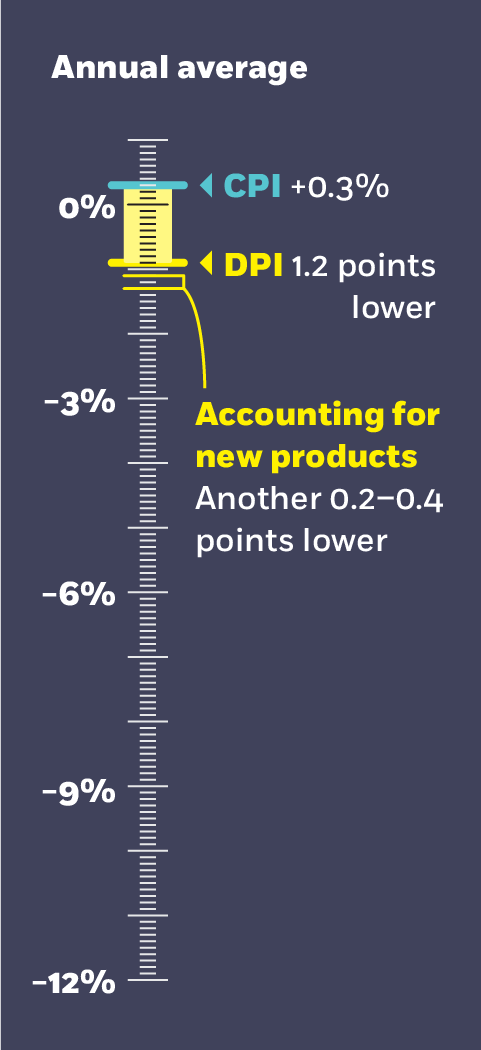
Food and beverages

Recreational products
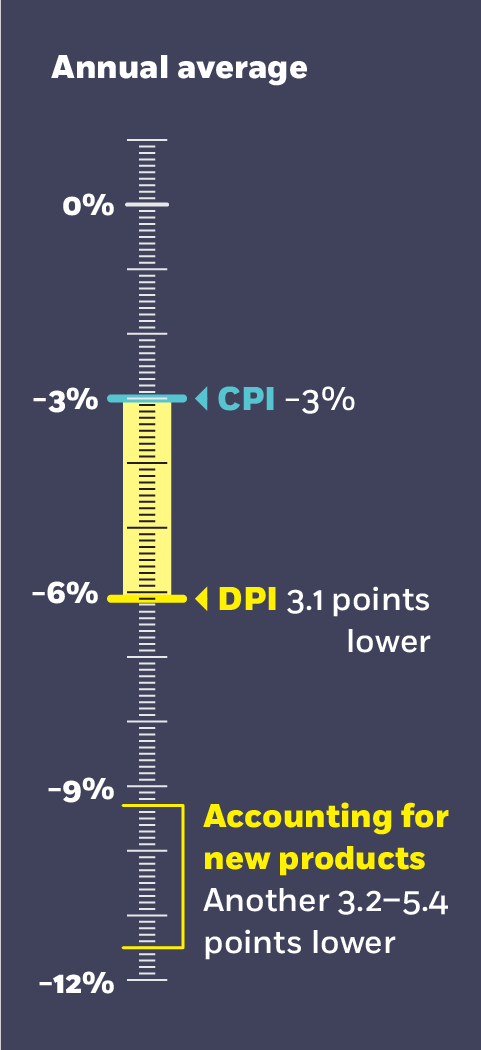

Tech products

Austan D. Goolsbee and Peter J. Klenow, “Internet Rising, Prices Falling: Measuring Inflation in a World of E-Commerce,” Working paper, June 2018.
Your Privacy
We want to demonstrate our commitment to your privacy. Please review Chicago Booth's privacy notice, which provides information explaining how and why we collect particular information when you visit our website.