How Opinion Polls Are Presented Affects How We Understand Them
- By
- January 04, 2019
- CBR - Behavioral Science
Pollsters, take note: there’s a significant difference between the way people perceive forecasts when they’re expressed as a statistical probability and when they’re presented as a percentage-point margin, according to Chicago Booth’s Oleg Urminsky and Chinese University of Hong Kong’s Luxi Shen, a recent Booth PhD graduate.
What are the chances you have this wrong?
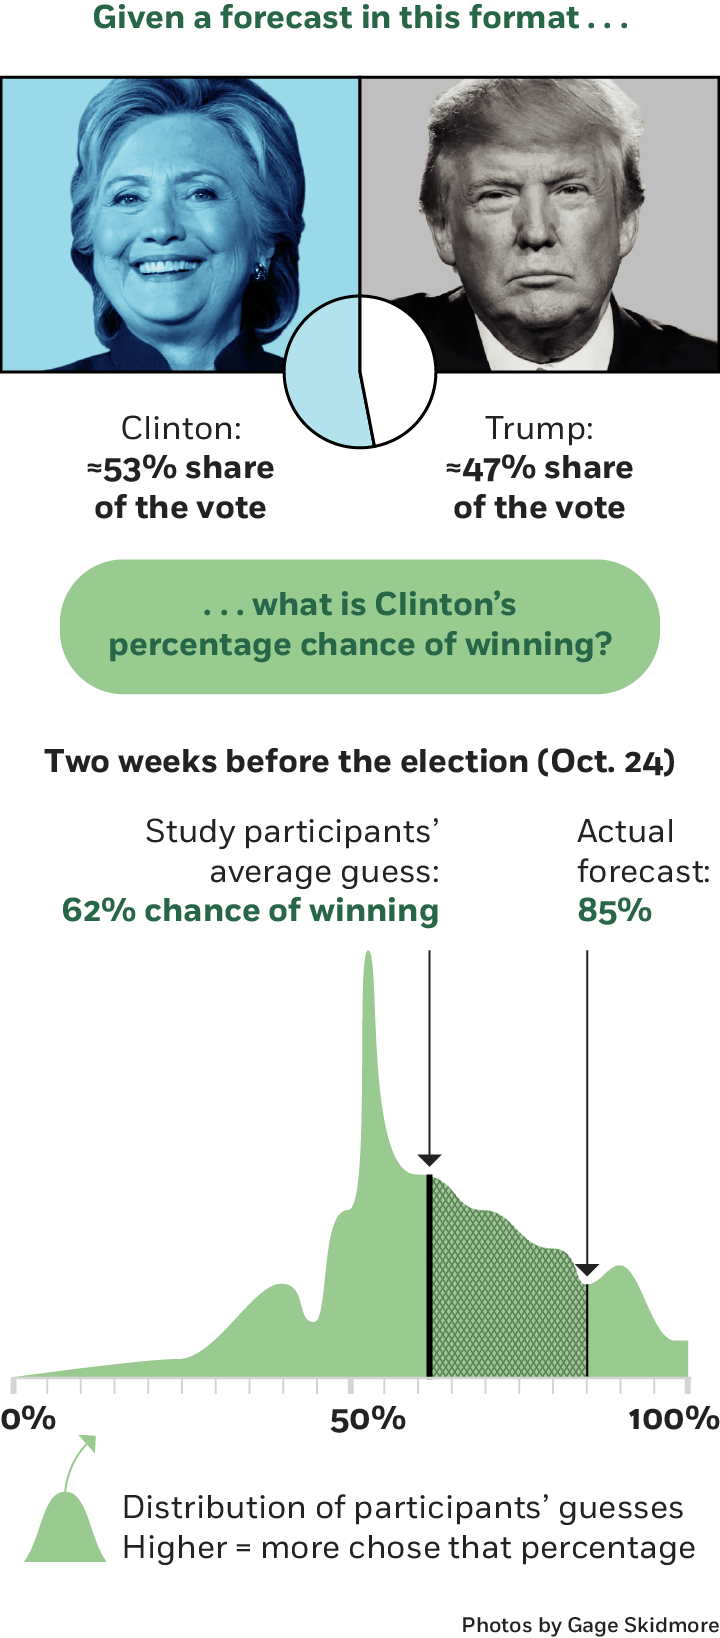
Study participants misinterpreted Hillary Clinton’s chances of winning the 2016 election versus her projected margin of victory.
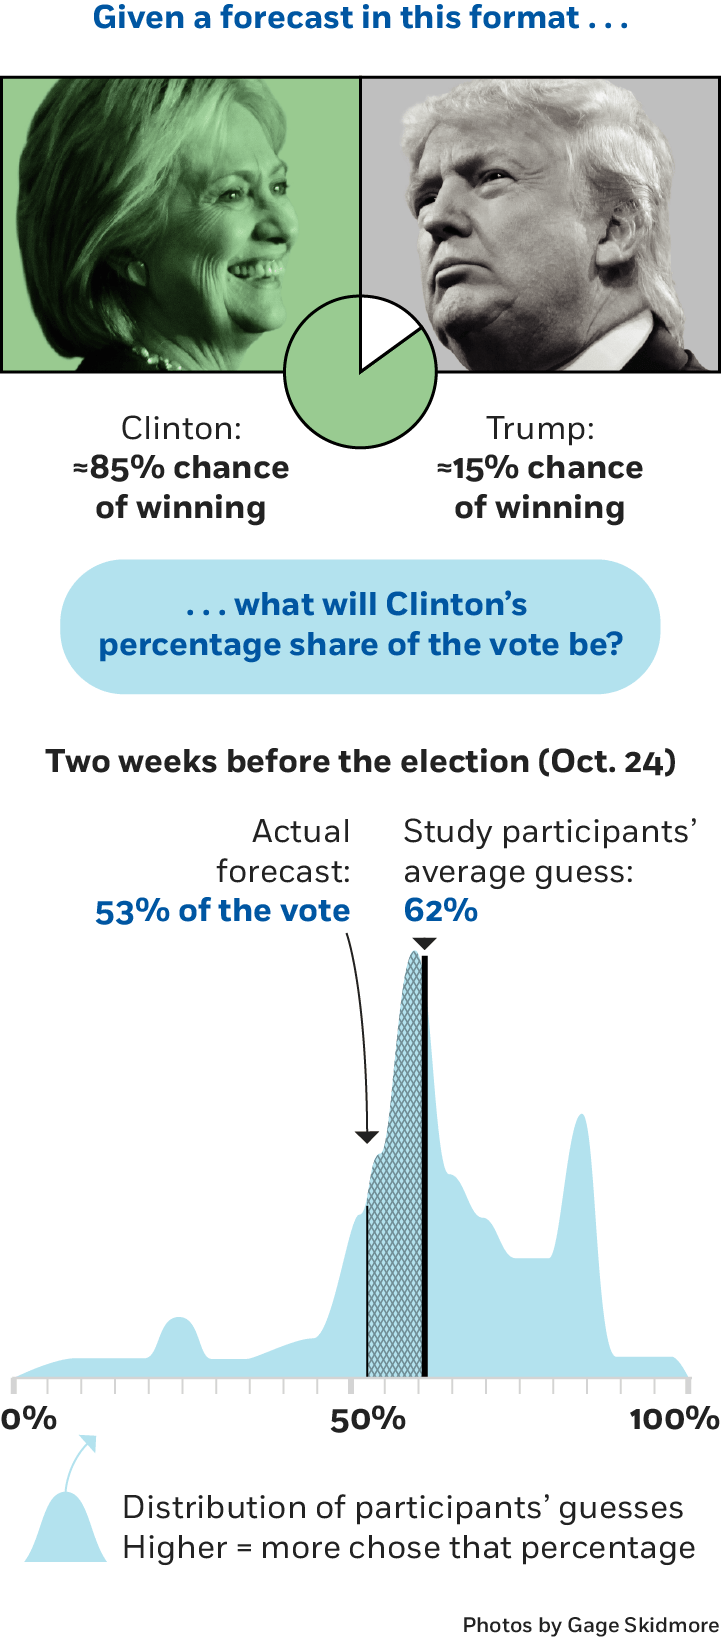
Urminsky and Shen used data provided by the prominent data-driven forecasting organization FiveThirtyEight leading up to the 2016 US presidential election. The researchers presented the then-current forecasts to two groups of study participants, but in different formats. One group saw probability projections that, on average, said Democratic candidate Hillary Clinton had a 74 percent chance of winning. The other group saw margin forecasts that said, on average, that she would get 53 percent of the vote.
On a given day, both forecasts represented the same snapshot in time—two essentially identical takes on Clinton’s expected victory. But participants interpreted the forecasts differently. When people saw the probability forecast and were then asked to estimate a margin by which Clinton would win, they overestimated, predicting she would get 60 percent of the vote on average, more than the 53 percent. Meanwhile, people shown the second, margin forecast predicted the probability of her winning at 60 percent on average rather than the actual 74 percent average.
Both predictions turned out to be incorrect, as Clinton won 48 percent of the vote and lost the election to Republican candidate Donald Trump, who received 46 percent. But they illustrated bias in people’s perceptions.
The difference in interpretations is unlikely to be explained by forecasters having the wrong assumptions in their models, the researchers say. In another study, even participants who were given a statistical reasoning problem with all the necessary information to get the right answer showed the same pattern.
“People overestimate margins when shown chance forecasts and underestimate chance forecasts when shown margin forecasts,” the researchers write.
They observe the same phenomenon in sports scenarios. Participants saw predictions for four upcoming professional basketball games, presented either as a percentage chance of winning or a point spread. For example, in a National Basketball Association October 2017 match-up, the Golden State Warriors had been given an 84 percent chance of beating the Washington Wizards, or were expected to win by 10 points. Once again, the researchers find that participants in the chance group overestimated what point spreads were expected to be, and those in the margin group underestimated the probability of winning.
This dichotomy extends even to people’s willingness to bet money on their convictions. Participants bet more when basketball forecasts were presented as chances than as margins. This was true for people of all degrees of familiarity with basketball. “A chance (vs. margin) forecast led to higher confidence about the outcome, and this higher confidence was expressed by the willingness to bet more on the game,” write Urminsky and Shen.
While the bias is unlikely to change major voting decisions, the phenomenon may well affect how people think about investing time and resources in political activism.
“When newspaper readers learn that a gerrymandered district has a 60 percent–40 percent split between voters of two political parties, for example, they may see the district as more competitive than it is,” the researchers write. “Readers may erroneously conclude that gerrymandering has less of an impact on election outcomes than it actually does.” Thus, the researchers suggest, perceptions of the future may depend on the format of forecasts as much as on the forecasts themselves.
Oleg Urminsky and Luxi Shen, “High Chances and Close Margins: How Equivalent Forecasts Yield Different Beliefs,” Working paper, September 2018.
Your Privacy
We want to demonstrate our commitment to your privacy. Please review Chicago Booth's privacy notice, which provides information explaining how and why we collect particular information when you visit our website.