
With Whole Foods, Can Amazon Fill Your Every Need?
It’s trying, by embracing scope, scale, and speed.
With Whole Foods, Can Amazon Fill Your Every Need?
Glen Gyssler
In the wake of Amazon buying Whole Foods, there has been much hand-wringing by analysts over the fate of supermarkets and supercenters. Clearly, the concern is that the merger will result in lower prices and improved efficiency of operations at Whole Foods, and will combine these prices and efficiencies with delivery, thereby severely impacting traditional supermarkets such as Kroger, as well as supercenters such as Walmart. Indeed, the stock prices of traditional supermarket chains suffered as a consequence of the deal.
It’s trying, by embracing scope, scale, and speed.
With Whole Foods, Can Amazon Fill Your Every Need?With the help of Chicago Booth MBA student Yogesh Kansal, I looked at audience reaction to the event on Twitter. In particular, we looked at the reaction the week before the June 16, 2017, announcement, the week after, and the week after the deal closed on August 28. Since one would expect an increase in the volume of tweets, we looked instead at other metrics such as sentiment and relative perceptions. For purposes of the analysis, we looked at Kroger, Walmart, and Safeway (as well as, of course, Amazon and Whole Foods).
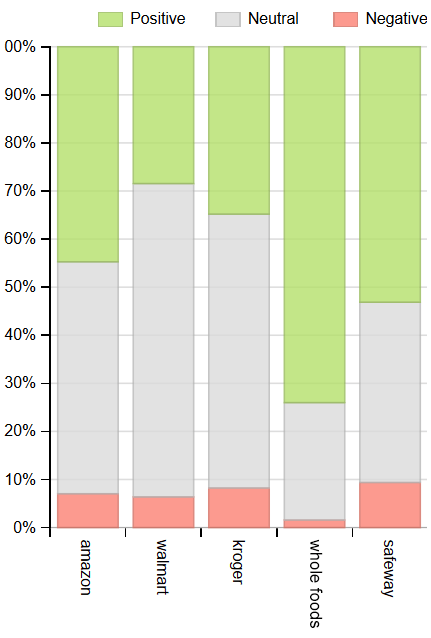
Before announcement
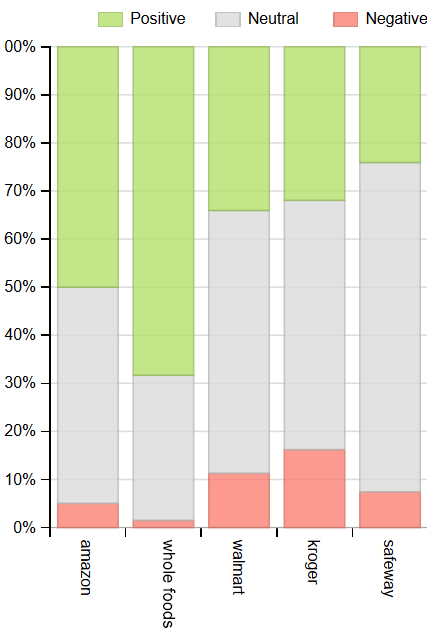
After announcement
At deal closing
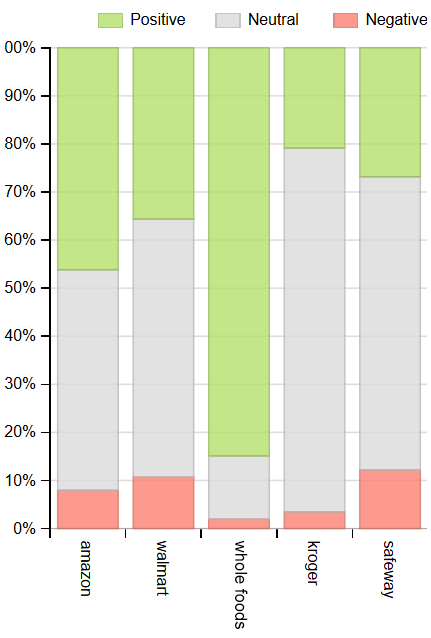
From the sentiment figures, we see that the positive sentiment for Amazon ranged from 45 to 50 percent (negative sentiment was 5–8 percent), with positive sentiment slightly rising and negative sentiment slightly dipping right after the announcement. However, in the week after the deal closed, positive sentiment for Whole Foods went up from about 68 percent after the announcement (it suffered a slight dip from 73 percent before the announcement) to 75 percent after the deal closed.
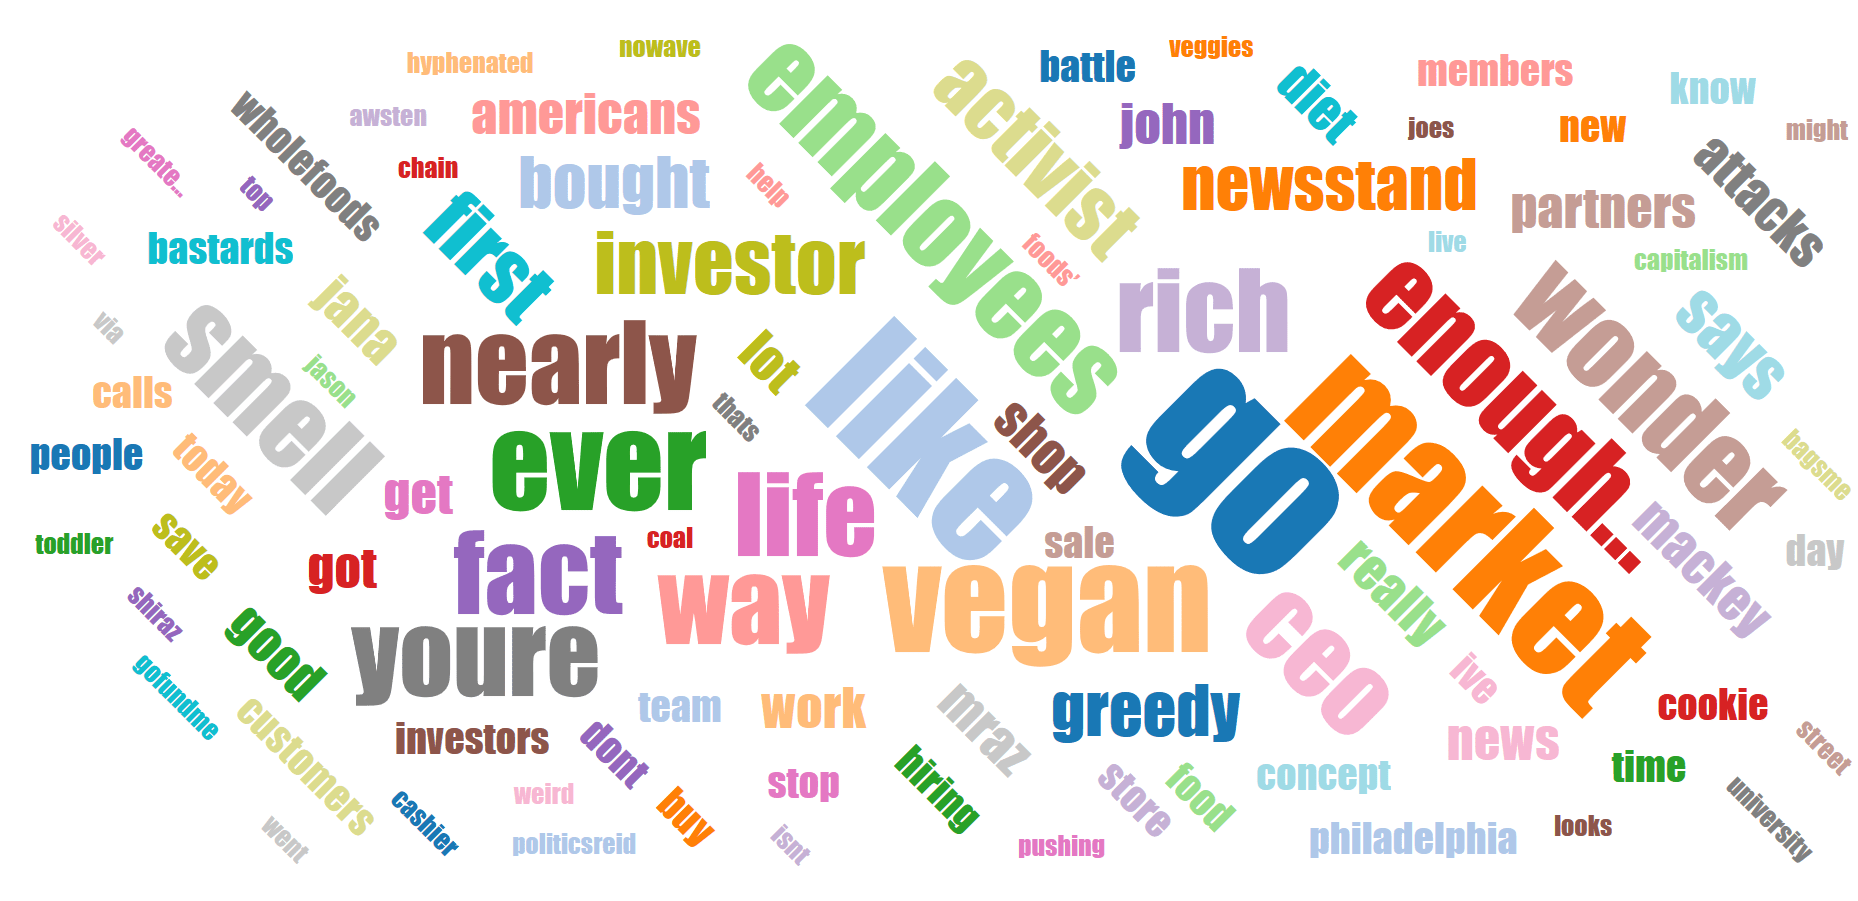
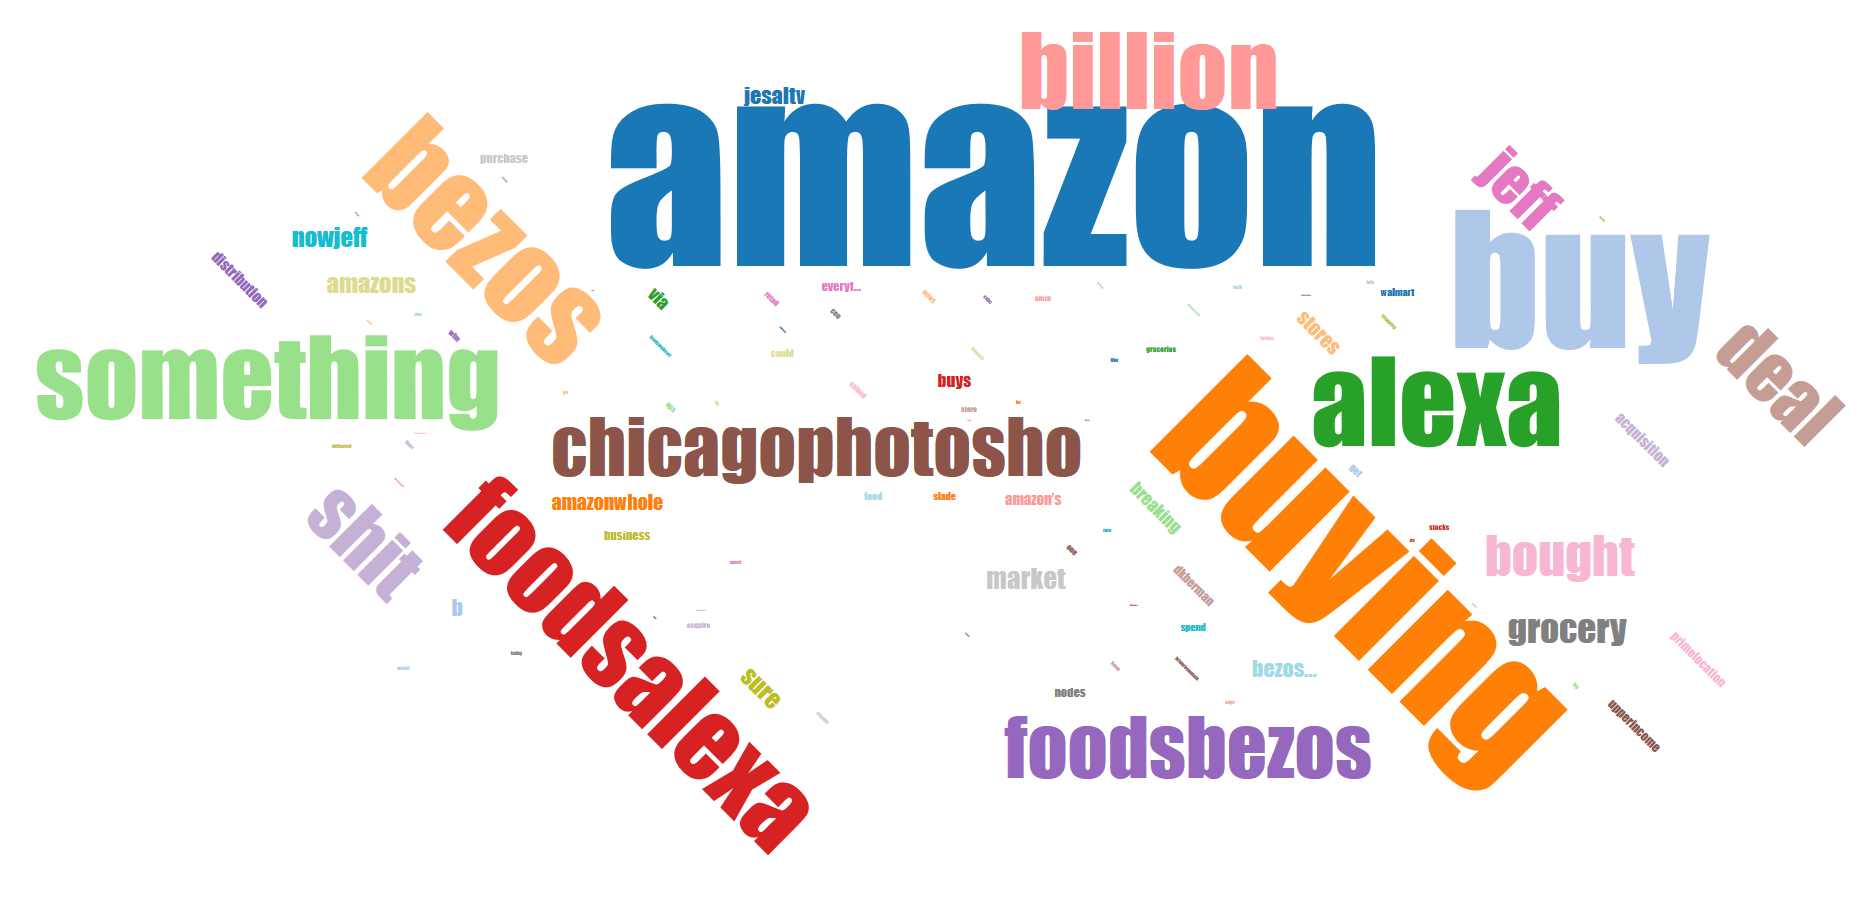
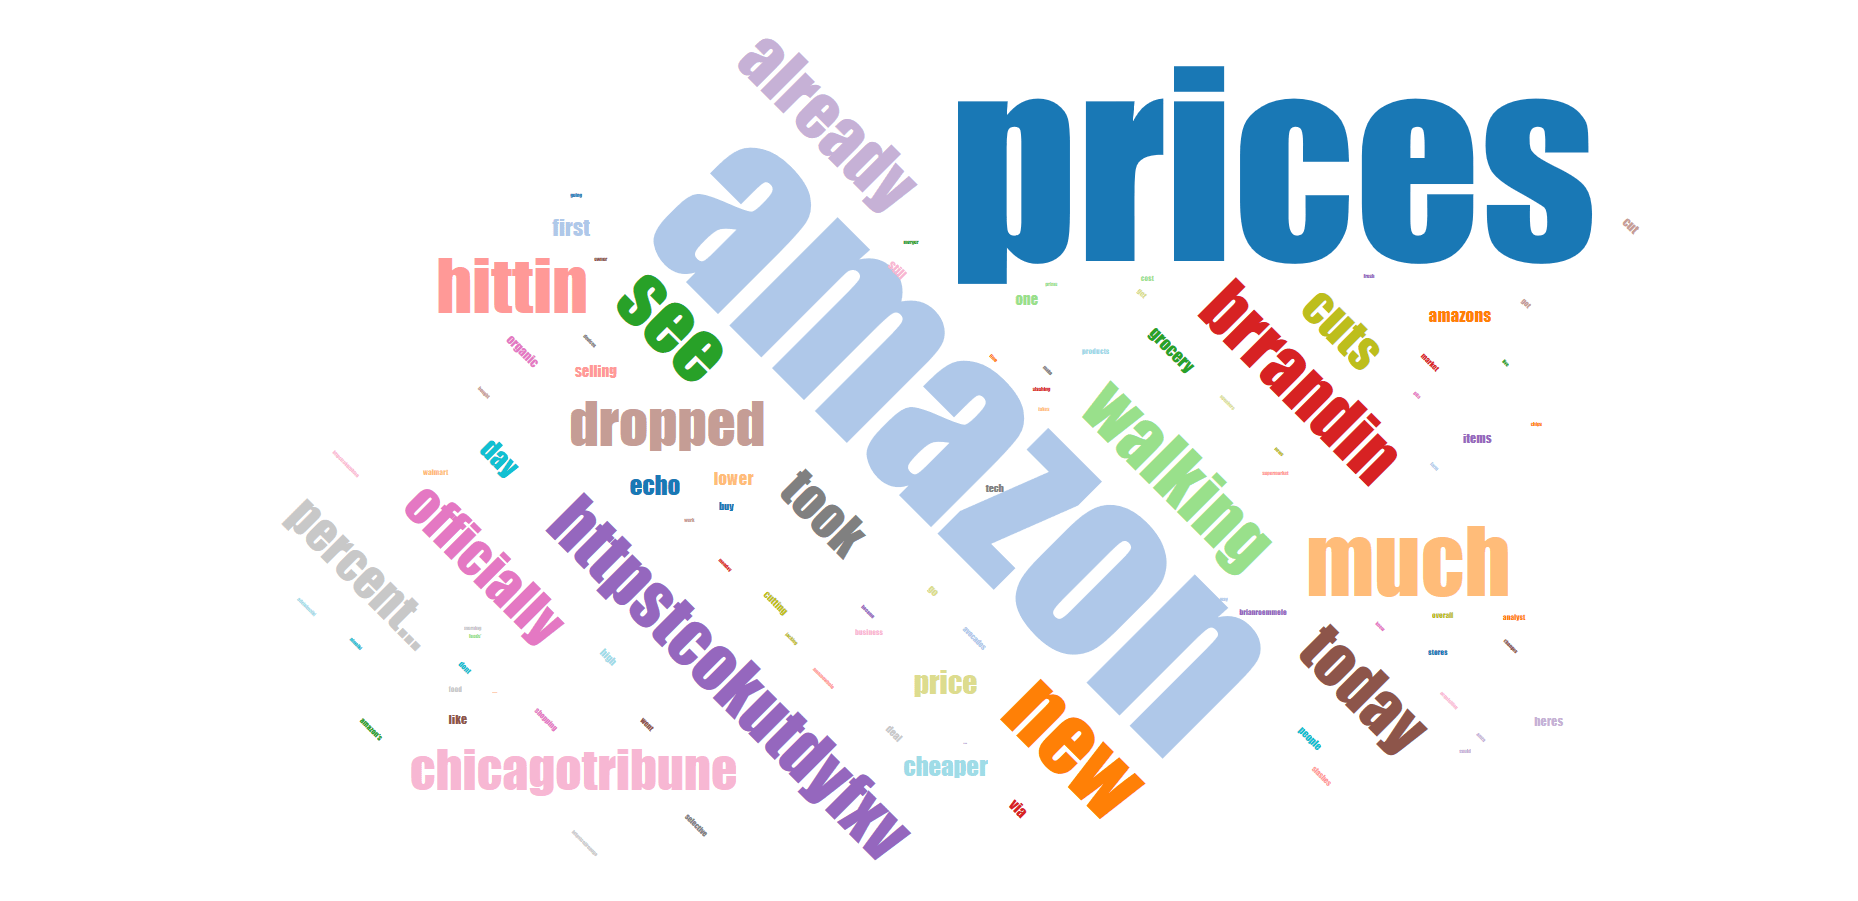
To dig more into possible reasons for the rise in positive sentiment, we looked at word clouds from the three periods for Whole Foods. The price cuts seem to have had some effect. Note that, in this case, the cuts are quite credible, i.e., this was not a case of the company replacing products with lower-quality items. Hence the perception of value was enhanced, leading to a more positive sentiment.
Before announcement
After announcement
At deal closing
So how did the other supermarkets fare in the eyes of the Twitterati? While the sentiment for Walmart does not seem to have been affected much, both Kroger and Safeway showed a change. In particular, Safeway saw a large drop in positive sentiment, from over 50 percent to just a bit over 20 percent. However, according to data examined over longer time periods—from May 1 to May 31 and from September 1 to September 24—the positive sentiment level for Safeway was between 25 and 30 percent, suggesting that there were idiosyncratic factors (combined with a relatively low tweet volume) that contributed to the high positive sentiment between June 9 and 15.
Kroger, on the other hand, does seem to have seen a drop in positive sentiment from the low to mid-30s, again verified by looking at data from May 1, to the low to mid-20s right up to September 24. However, here as well there is the confounding factor of Hurricane Harvey, at least for the latter part of August, although this would not necessarily explain the stable September numbers.
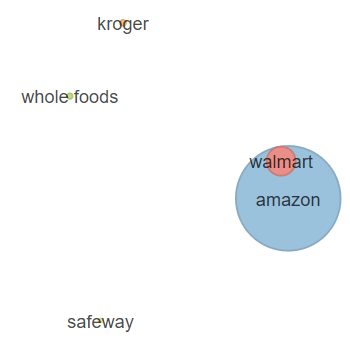
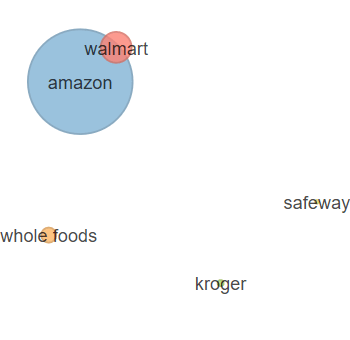
Next, we looked at the relative perceptions of the retailers over time. As mentioned in previous CBR essays (such as “As Sears fails, who will buy its brands?” Summer 2017), these maps are constructed from similarity metrics constructed between each retail pair. The similarity metrics are obtained from looking at the overlap in words used on Twitter to describe the retailer in each time period considered. The size of the circles represents the volume of tweets associated with that retailer. The maps below suggest that Twitter users’ perceptions of the retailers only changed in the short run and, by the time the merger closed, had reverted back to what they had been before the announcement. So at least in the immediate aftermath, we do not see any fundamental changes in perceptions of the various retailers.
Before announcement
After announcement
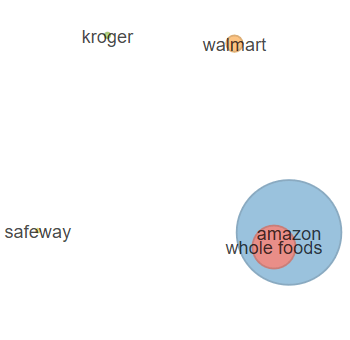
At deal closing
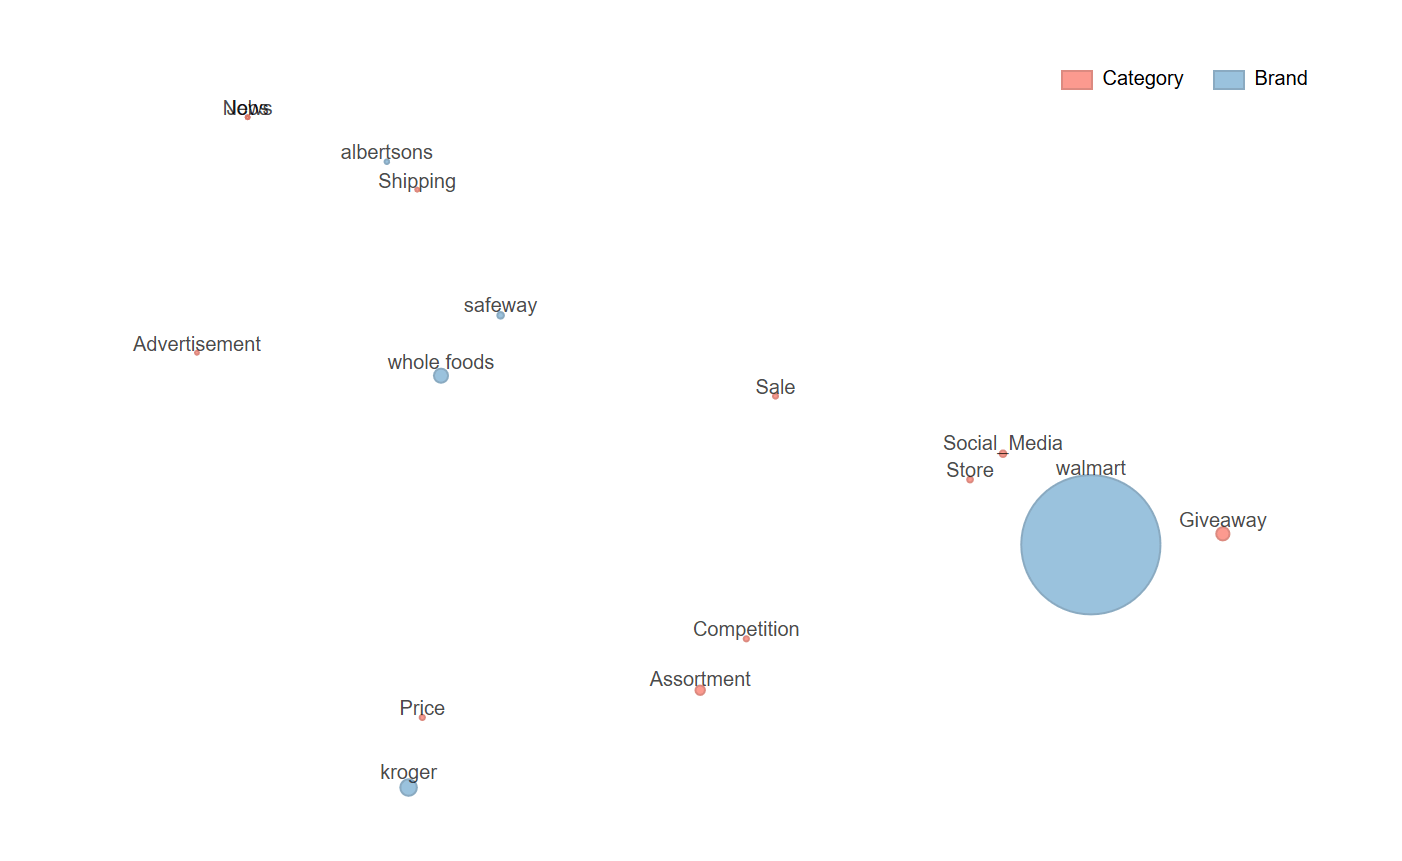
In the last piece of analysis, we looked at the topics associated with the tweets for each of the retailers in each of the three time periods. There are several noteworthy points to glean from the pictures. The first is that Walmart and Whole Foods were generally located at opposite ends of the spectrum in each time period. Walmart was associated with social media, giveaways, and its stores. Whole Foods, on the other hand, was associated with several features but not strongly pegged to any of them.
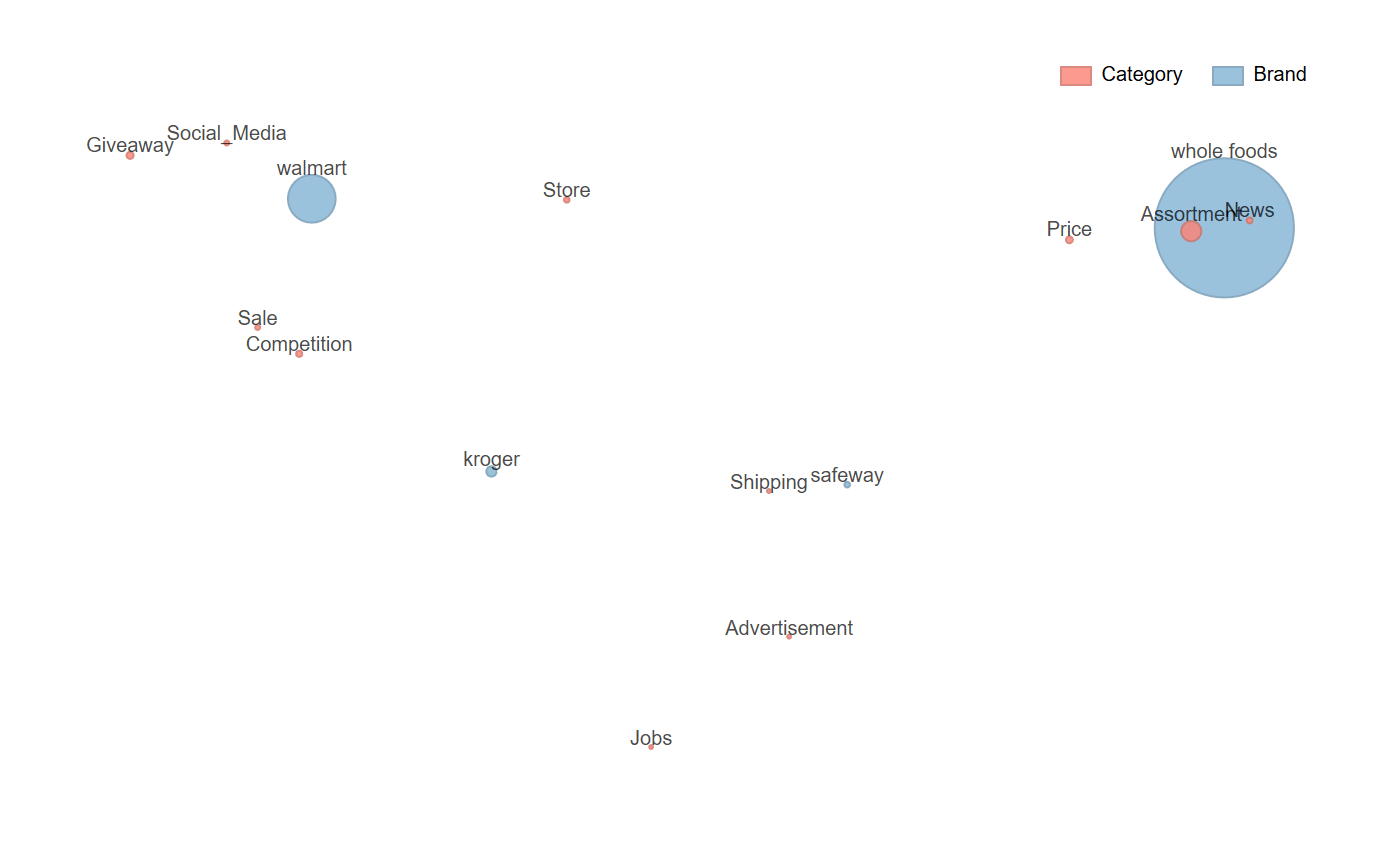
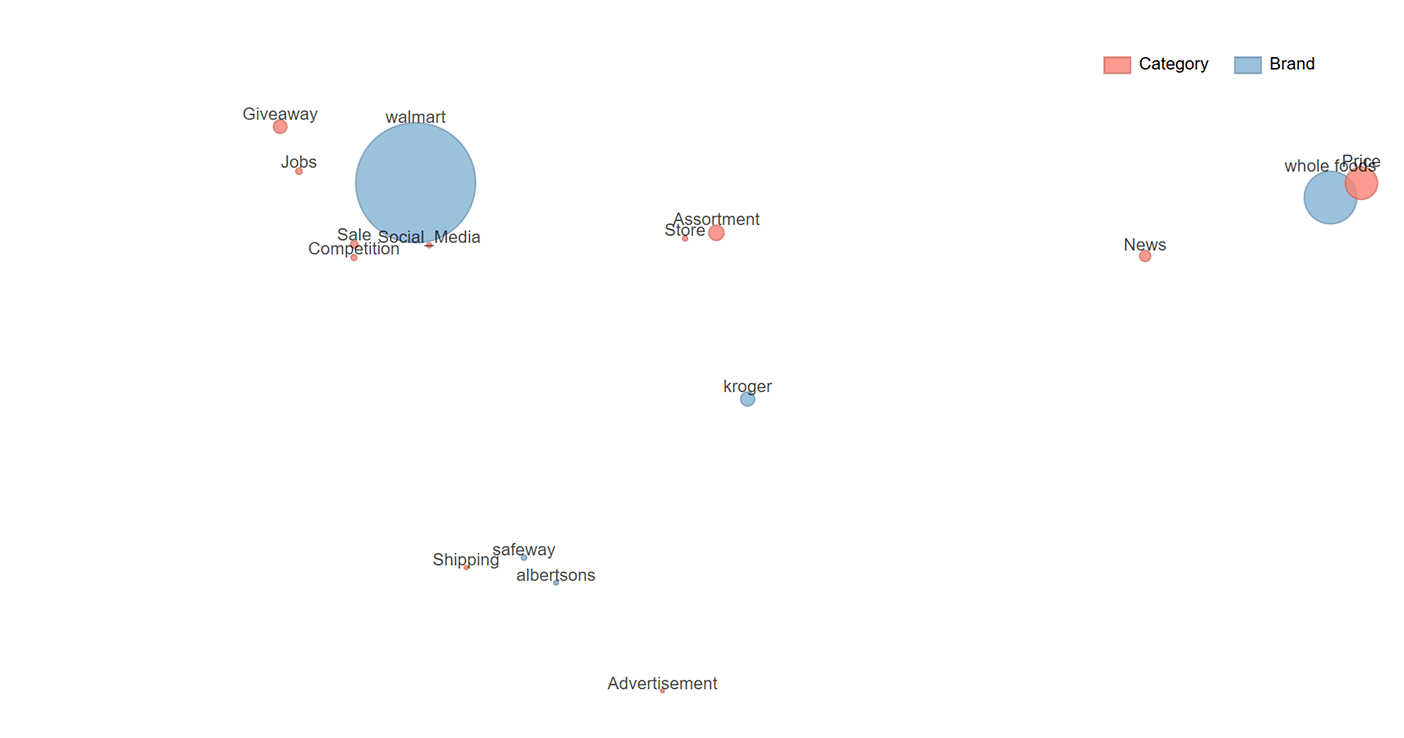
After the announcement, however, we see a marked change. While Whole Foods and Walmart were still viewed as “opposites,” the former showed a strong association with price and assortment, whereas Walmart’s main features continued to be its stores, giveaways, and social media. Finally, after the merger closed, Whole Foods retained its association with price, largely because of the price cuts instituted by Amazon. Assortment shifted back toward Walmart and appeared equidistant to both retailers. Thus it seems Amazon was able to clearly highlight the impact it was having or planning to have on prices at Whole Foods.
Another observation from these maps is that, by and large, Albertsons and Safeway stores, which share the same ownership umbrella, had reasonably proximal locations on all maps. At least from a positioning perspective, this is good news for these retailers in terms of projecting a uniform image to consumers.
Before announcement
After announcement
At deal closing
To summarize, the data seem to reveal some short-term changes in sentiments, perceptions, and associations for these top retailers. Whether these changes can be sustained over time, and whether they prove more or less successful for the retailers, remains to be seen.
Pradeep K. Chintagunta is Joseph T. and Bernice S. Lewis Distinguished Service Professor of Marketing at Chicago Booth. He thanks Booth MBA student Yogesh Kansal for his feedback and input.
Your Privacy
We want to demonstrate our commitment to your privacy. Please review Chicago Booth's privacy notice, which provides information explaining how and why we collect particular information when you visit our website.