CBR Briefing #69
- July 24, 2019
- CBR - Finance
Which economic indicators are investors watching?
- Investors are inundated with data to assess the economy and forecast returns, but little is known about what they focus on. Many economists believe that investors look at consumption growth alone, but investors focus on a wider set of information, according to Chicago Booth’s George M. Constantinides and McGill University’s Anisha Ghosh.
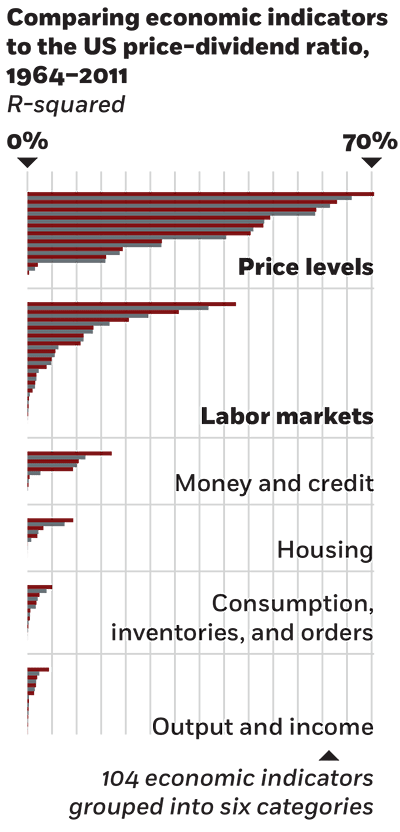
- The researchers find that price-level variables, such as the Consumer Price Index, and labor-market variables, such as average hourly earnings, are highly correlated with the market price–dividend ratio, an indicator of investors’ expectations about future dividend growth and discount rates. By contrast, they find negligible correlation between the price- dividend ratio and consumption growth.
- The researchers incorporate this observation into a model that explains several features of stock market data and performs well in predicting future returns, which a model based on learning from consumption alone cannot.
Anisha Ghosh and George M. Constantinides, “What Information Drives Asset Prices?” Working paper, August 2017.
More from Chicago Booth Review
More from Chicago Booth
Your Privacy
We want to demonstrate our commitment to your privacy. Please review Chicago Booth's privacy notice, which provides information explaining how and why we collect particular information when you visit our website.