A Daily Measure of People’s Potential Exposure to COVID-19
- By
- September 03, 2020
- CBR - Public Policy
Driven by a virus that can be transmitted by people who don’t realize they have it, the COVID-19 crisis has generated a surge of interest in people’s movements. While US states such as Washington and New York were hot spots in early 2020, infections later spiked in several others, including Florida and Arizona. These regional flare-ups have presented a challenge to governors, county officials, and other local leaders who seek timely insight into how infections might be spreading.
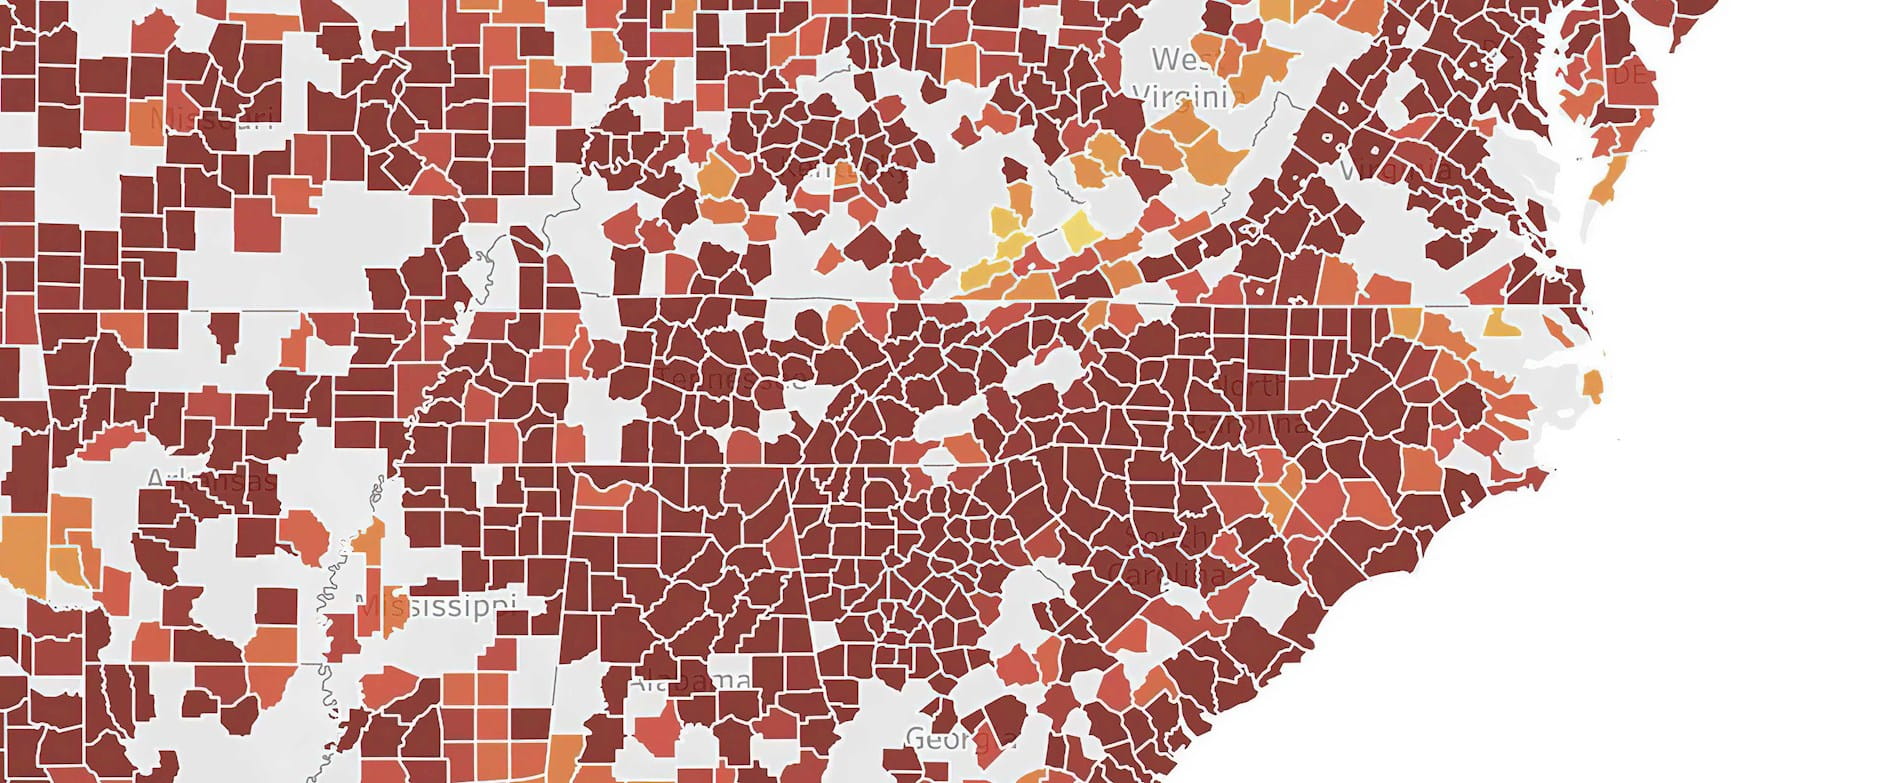
A team of researchers has generated some tools that could help—indexes that provide daily snapshots of people’s movements both within and between about 2,000 of the largest counties by population, across all 50 states.
University of California at Berkeley’s Victor Couture, Chicago Booth’s Jonathan Dingel, Princeton PhD candidate Allison E. Green, University of Pennsylvania’s Jessie Handbury, and Yale’s Kevin R. Williams used anonymized location data from mobile devices to track people’s travels and to calculate measures of people’s exposure to one another by looking at the number of devices that were at the same places on a given day, such as stores or restaurants.
Going back to January 2020, the researchers’ indexes provide a daily look at Americans’ movement patterns amid the pandemic’s spread. The following maps illustrate a selection of their results.
Victor Couture, Jonathan I. Dingel, Allison E. Green, Jessie Handbury, and Kevin R. Williams, “Measuring Movement and Social Contact with Smartphone Data: A Real-Time Application to COVID-19,” Working paper, July 2020.
Your Privacy
We want to demonstrate our commitment to your privacy. Please review Chicago Booth's privacy notice, which provides information explaining how and why we collect particular information when you visit our website.