

Chicago Booth Full-Time MBA Class of 2025 Profile
Each year Chicago Booth's Full-Time MBA Program looks to build a class of future business leaders that will make a positive impact on the world around us. Placing an emphasis on diversity of thought, background, and career objectives, we attract ambitious, supportive, and intellectually curious professionals. We invite you to get to know the Class of 2025!
4184
Applications Submitted
4184
20
JD/MBA Accelerated Students
20Enrollment Breakdown

Our Global Footprint
3% Africa
17% Asia
1% Canada
11% Central/South America & Mexico
3% Europe
1% Middle East
64% United States
<1% Other
54
Countries Represented
54
49%
Students Born Outside of The United States
49%
12%
First Generation Students1
12%
36% International
As the global landscape changes each day, the presence of international perspectives in the classroom is more valuable now than ever before. We're sensitive to the unique needs and challenges faced by this group and work to support them as they adjust to living and learning in the US.
36% International
42% Women
Continually confronted with unique challenges in the workplace and when working through the application process, our supportive community celebrates women’s perspectives and highlights their accomplishments. As women are reaching new heights across industries, we are committed to building the skills and acumen they need to continue advancing.
42% Women
11% Veterans
Since 2006, the number of veteran MBA students enrolled at Chicago Booth has increased by nearly 300 percent. As the community has grown, our Armed Forces Group (AFG) has been instrumental in offering mentorship and support to veterans applying for and pursuing their MBA. Of the Class of 2025's veteran community, eight percent served in the US Military Service.
11% Veterans
12% LGBTQ+
The LGBTQ+ community at Booth represents students with a diverse range of identities and expressions of gender and sexual orientation. Whether you identify as lesbian, gay, bisexual, transgender, queer, questioning, or as an ally to your peers, you’ll find a supportive network that actively amplifies unique voices through inclusive events, ongoing activism, and the OUTreach student group.
12% LGBTQ+US Race / Ethnicity
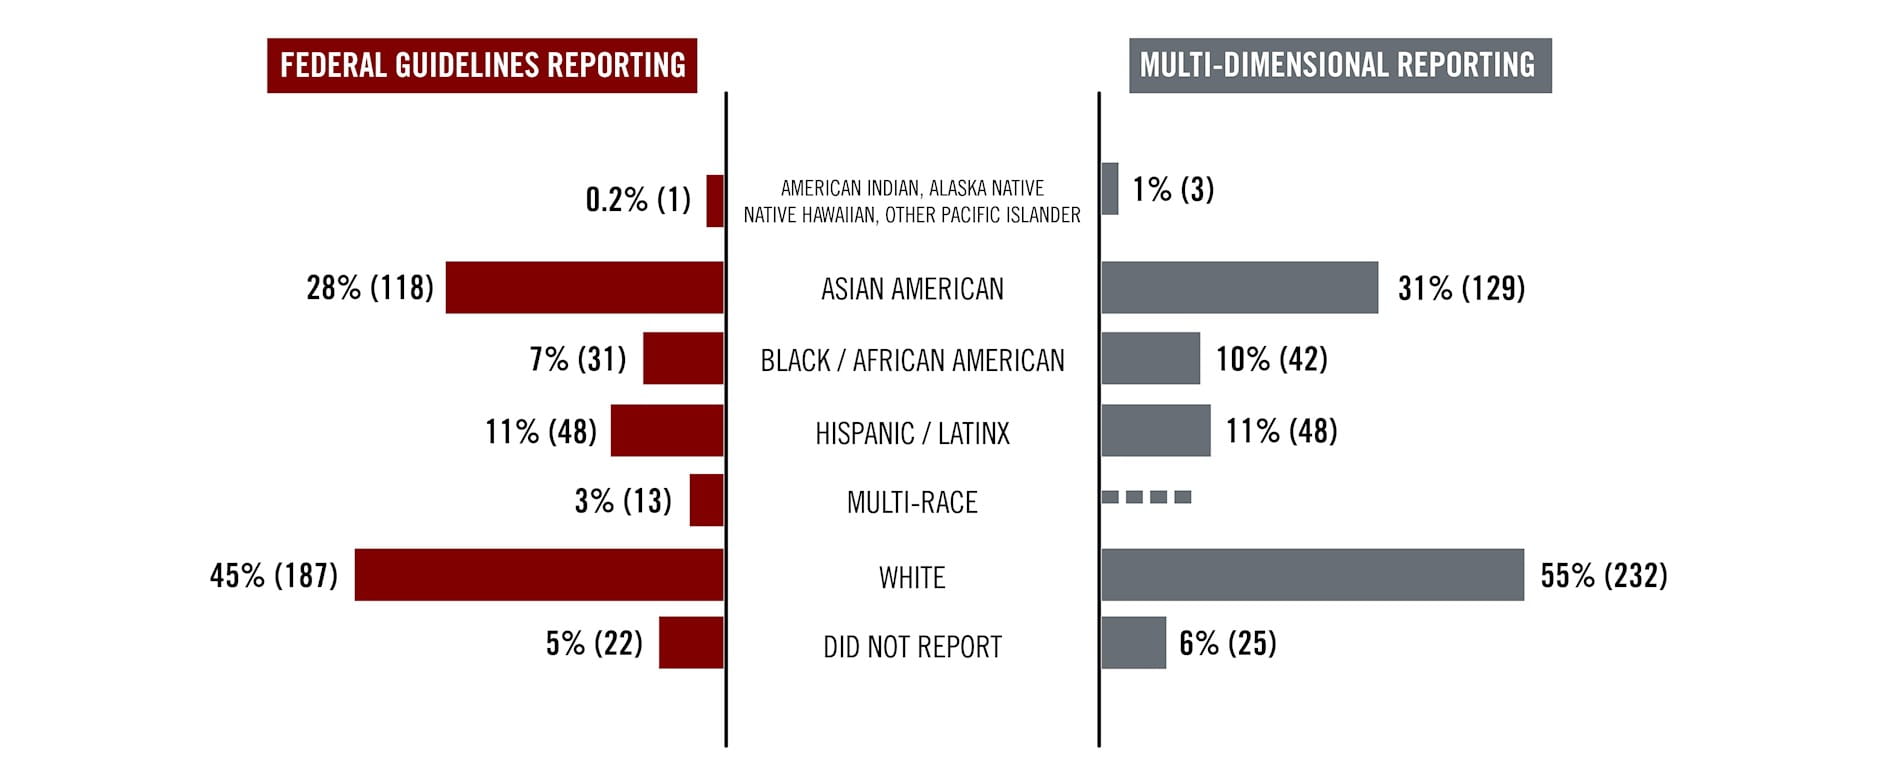
Infographic Transcript
Federal Guidelines Reporting
American Indian, Alaska Native, Native Hawaiian, Other Pacific Islander –
Asian American – 119 (39%)
Black / African American – 17 (4%)
Hispanic / Latinx – 38 (10%)
Multi-Race – 14 (4%)
White – 195 (49%)
Do Not Report - 14 (4%)
Multi-Dimensional Reporting
American Indian, Alaska Native, Native Hawaiian, Other Pacific Islander – 7 (2%)
Asian American – 129 (32%)
Black / African American – 27 (7%)
Hispanic / Latinx – 38 (10%)
Multi-Race –
White – 234 (59%)
Do Not Report – 16 (4%)
US race/ethnicity enrollment is shown as a percent of US citizens and permanent residents within the class. Chicago Booth adheres to federal guidelines for maintaining, collecting, and presenting data on race and ethnicity as provided by The Department of the Interior via the Office of Civil Rights. These standards allow students to self-identify their ethnicity and race, with the option to select more than one race and/or ethnicity. The racial and ethnic categories listed here reflect those included in our application. Multi-Dimensional Reporting depicts students’ full racial and ethnic identities to more inclusively reflect the racial/ethnic groups they identify with beyond a grouping of “Multi-Race,” within the Federal Guidelines. This results in an aggregate of more than 100 percent.

Our Commitment to Diversity and Inclusion
Chicago Booth is steadfastly committed to building a more diverse and inclusive world, and to leading change within our own community.
Our Commitment to Diversity and InclusionEmployment
28
Average Age of Full-Time Student
28
5
Average Years of Work Experience
5
Pre-Booth Industries
The motivating factors for pursuing an MBA are as diverse as our students’ career backgrounds. What remains consistent is their ability to thrive in a flexible environment that allows them to build deeper knowledge in the areas they’re passionate about and fill knowledge gaps along the way.
Pre-Booth Industries
Post-Booth Career Impact
At its most basic level, The Chicago Approach teaches students how to think not what to think, building business foundations and analytical tools needed for the jobs of today and tomorrow. The Class of 2025 will join a global network of nearly 57,000 Booth alumni making an impact in the world around us.
Post-Booth Career ImpactEducation

Undergraduate Majors Represented
Degree Breakdown:
Business – 25%
Engineering – 25%
Economics – 25%
Liberal Arts – 13%
Physical Sciences - 9%
Other – 4%
There's only one standard educational background that leads to an MBA, right? Wrong. Our MBA program attracts students from all academic backgrounds, including areas like education, political science, psychology, engineering, and yes, business, too. Our environment allows you to self-select into courses and experiences based on your interests while building critical leadership skills that are transferable across any industry. If you're currently pursuing an undergraduate degree, we encourage you to explore our Chicago Booth Scholars.
Undergraduate Majors Represented
277
Undergraduate Institutions
277
3.6
Average GPA2
3.6
2.4-4
GPA Range3
2.4-4
19%
Hold Graduate Level Degrees
19%Begin Your MBA Journey
The first step in joining our transformational Full-Time MBA Program is to apply for admission.
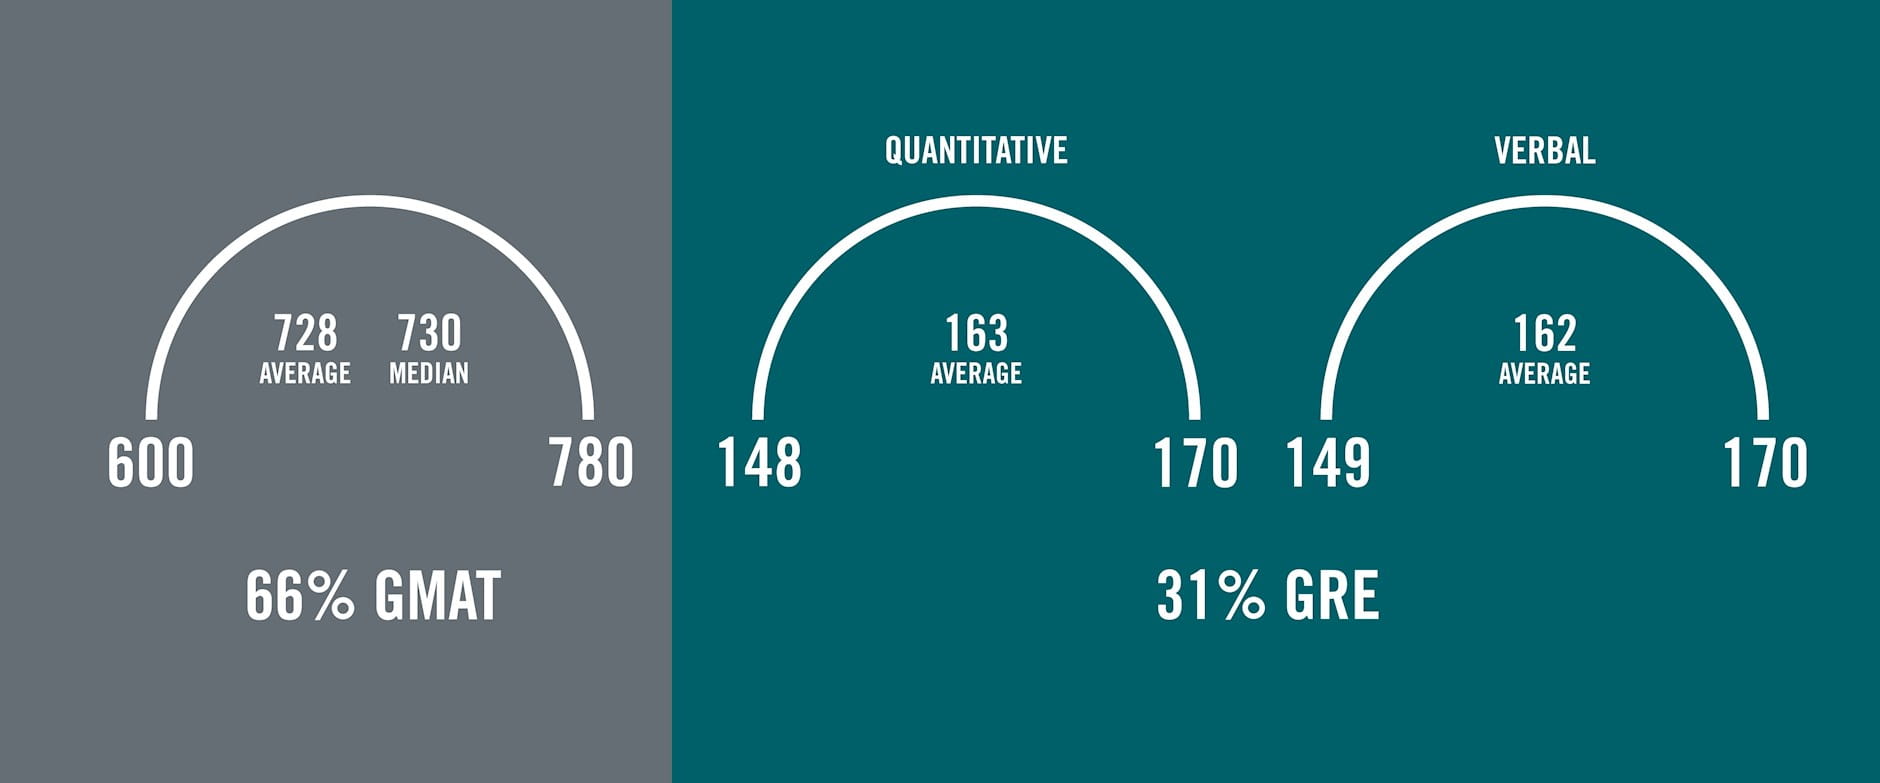
Test Scores
Our application review is a holistic process, taking into consideration your career and educational background as well as your goals and letters of recommendation from those who know you best. Your GMAT/GRE score is one component of our evaluation process and we encourage you to keep that in mind when reviewing the Class of 2025 submitted score ranges and averages below.4 When you're ready to apply, here's some helpful advice from Booth students.
| Average | Median | |
|---|---|---|
| 73% GMAT |
729 |
730 |
| 26% GRE - Quantitative |
164 | |
| 26% GRE - Verbal |
163 |
Class Profiles of the Past 5 Years
| Class Of | 2024 |
2023 | 2022 | 2021 | 2020 |
|---|---|---|---|---|---|
| Class Size (including Accelerated JD/MBAs) |
634 | 620 |
621 | 593 | 591 |
| Average GPA | 3.6 | 3.5 |
3.6 | 3.6 | 3.6 |
| Average Student Age | 28 | 28 |
28 | 28 | 28 |
| International Students | 37% | 39% |
30% | 31% | 30% |
| Gender | 40% Female |
42% Female |
38% Female | 42% Female | 42% Female |
| GMAT Average | 729 | 732 |
724 | 730 | 731 |
| Average GRE Verbal/Quant | 163/164 | 162/163 |
163/163 | 163/164 | 163/164 |
| Average Work Experience | 5 Years |
5 Years |
5 Years | 5 Years | 5 Years |
| Class Of | 2024 | 2023 | 2022 | 2021 | 2020 |
|---|---|---|---|---|---|
| Business | 25% | 27% | 28% | 29% | 24% |
| Economics | 25% | 24% | 24% | 22% | 25% |
| Engineering | 24% | 24% | 24% | 21% | 24% |
| Law | 1% | 1% | 1% | 1% | 1% |
| Liberal Arts | 13% | 12% | 13% | 15% | 14% |
| Other | 4% | 5% | 4% | 4% | 4% |
| Physical Sciences | 9% | 9% | 10% | 9% | 7% |
| 2024 |
2023 | 2022 | 2021 | 2020 |
|---|---|---|---|---|
| 25% Consulting |
23% Consulting |
25% Consulting | 25% Consulting | 23% Consulting |
| 19% Financial Services |
20% Financial Services |
20% Financial Services | 21% Financial Services | 20% Financial Services |
| 13% Technology | 12% Technology |
11% Technology |
10% Non-Profit/Government | 9% Technology |
| 11% Non-Profit/Government |
11% Non-Profit/Government |
10% Non-Profit/Government | 10% Technology | 9% Non-Profit/Government |
| 6% Healthcare |
7% Private Equity/Venture Capital |
8% Private Equity/Venture Capital | 8% Private Equity/Venture Capital | 8% Private Equity/Venture Capital |
| Class Of | 2024 |
2023 | 2022 | 2021 | 2020 |
|---|---|---|---|---|---|
| Africa | 3% | 1% | 1% | 1% | <1% |
| Asia | 15% | 16% | 11% | 13% | 13% |
| Canada | 3% | 3% | 3% | 1% | 1% |
| Central/South American & Mexico | 12% | 13% | 9% | 11% | 12% |
| Europe | 3% | 4% | 3% | 2% | 3% |
| Middle East | 1% | 2% | 2% | 2% | 2% |
| United States | 63% | 61% | 70% | 70% | 72% |
1 Self-Reported
2 GPA average out of a 4.0 scale for domestic applicants
3 GPA range is based on a 4.0 scale for US based institutions
4 Full GMAT score range is 200-800; Verbal Reasoning and Quantitative Reasoning measures of the GRE General test is 130-170
4 Full GMAT score range is 200-800; Verbal Reasoning and Quantitative Reasoning measures of the GRE General test is 130-170